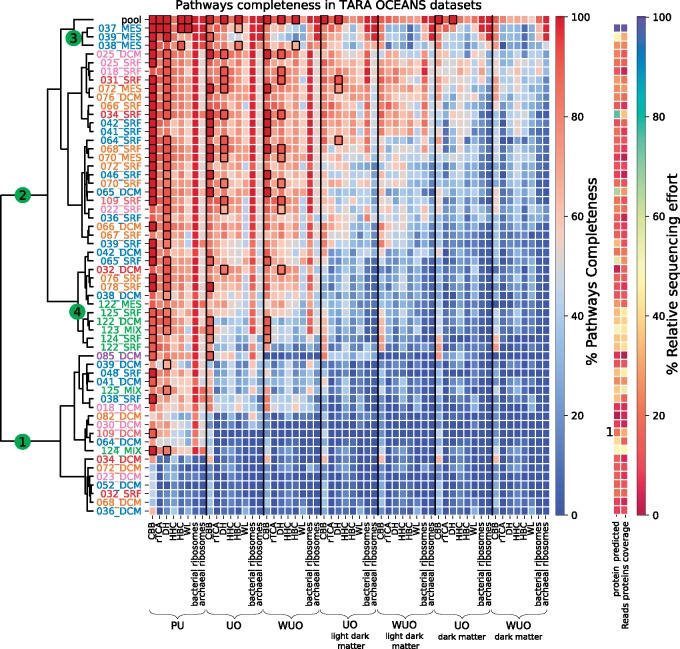
Fig. 5.
—Heatmap of completeness of six carbon fixation pathways and archaeal and bacterial ribosomal complexes. The heatmap color scale shows the completeness of pathways or ribosomal complexes, with rows as sampling sites and columns as proteins sets. Black squares highlight sites with pathway completeness >60% and comprising all key enzymes. Rows were clustered using scipy.cluster.hierarchy.linkage (“ward” method). The corresponding dendrogram is shown to the left of the heatmap. Row names indicate sampling sites in the format TARA sampling site id (three digits) _ depth. Depths are: SRF (Surface), DCM (Deep Chlorophyll Maximum), MES (Mesopelagic), and MIX (mixed). Row label colors represent oceanic regions: brown for North Pacific Ocean, green for South Pacific Ocean, purple for Southern Ocean, orange for South Atlantic Ocean, dark blue for Indian Ocean, red for Red Sea, and pink for Mediterranean Sea. The “pool” row represents results for all sampling sites pooled together. Ribosomal complexes from bacteria and archaea contain 55/67 proteins, respectively, and share 31 proteins. Sequencing effort is computed as the proportion of the number of proteins found at a given site and the average number of reads per protein, relatively to the values found at 037_MES sampling site, which showed the maximum values for both indicators.

