Fig. 5.
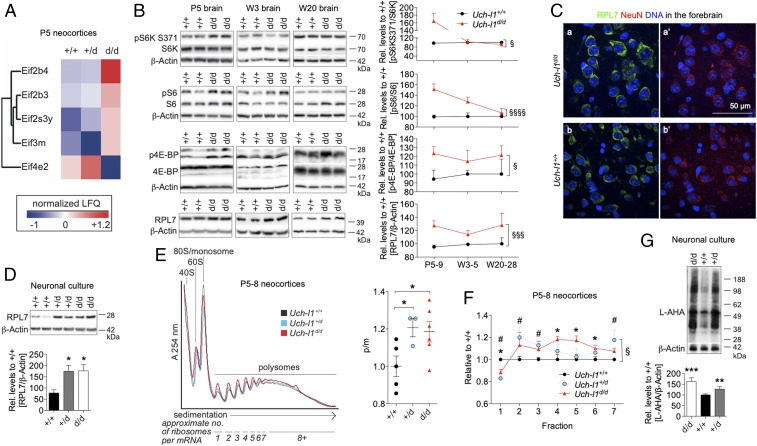
Protein synthesis is enhanced in UCH-L1–deficient neurons. (A) Heat map of significantly changed eIF (eukaryotic translation initiation) subunit protein expression determined by proteomic analysis. Proteins of the eIF complex quantified with fold change of log2(d/d/control) or log2(d/+/control) larger 1 and FDR < 0.2, means per genotype; n = 3. (B and D) WB for the activation [phosphorylation (p)] of kinases involved in transcriptional activation such as the p70 ribosomal S6 protein kinases (S6K), ribosomal protein S6 (S6), the eukaryotic initiation factor 4E-binding proteins (4E-BPs), and for the large ribosomal subunit RPL7 in (B) postnatal day 5 (P5), 3-wk-old (W3), and 20-wk-old (W20) brain lysates of Uch-l1d/d and Uch-l1+/+ and in (D) cultured neurons. Right graphs demonstrate densitometric quantification in B 3 exp. n = 5–9; §P < 0.05, §§§P < 0.001, §§§§P < 0.0001 (effect of genotype by two-way ANOVA). In D 3 exp. n = 5–9; *P < 0.05 (Bonferroni test after one-way ANOVA). (C) Confocal images for ribosomal RPL7 (a and b), which localizes to NeuN positive neurons (a′ and b′) in frontal cortical neurons of 3-wk-old Uch-l1d/d and Uch-l1+/+. (E) Overlay of polysome profiles from neocortices of Uch-l1+/+, Uch-l1+/d, and Uch-l1d/d postnatal day 5. Graph: normalized polysome-to-monosome (p/m) ratio for Uch-l1+/d and Uch-l1d/d vs. Uch-l1+/+ neocortices; 3 exp. n = 3–6; *P < 0.05. (F) Bin analysis of changes in polysome fractions; 3 exp. n = 3–6; #P < 0.05 Uch-l1+/+ versus Uch-l1+/d and *P < 0.05 Uch-l1+/+ versus Uch-l1d/d at the indicated fraction, §P < 0.05 (effect of genotype x fraction, mixed two-way ANOVA). Note the significant shift of ribosomes from lighter to heavier polysomes in Uch-l1+/d and Uch-l1d/d. (G) Measurement of new protein synthesis rate in primary neurons by incorporation of the methionine analog l-AHA HCl during a 1-h pulse. Densitometric quantification of l-AHA incorporation; 3 exp. n = 8–14; **P < 0.01; ***P < 0.01 to Uch-l1+/+.

