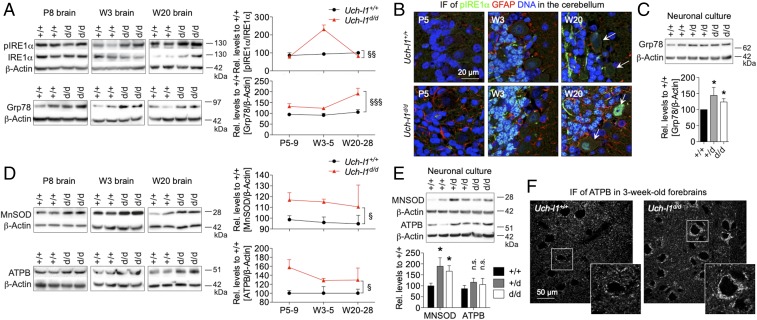
Fig. 6.
UCH-L1 defiency results in neuronal strain. Uch-l1d/d brains were analyzed for the occurrence of ER stress and for signs of energy depletion. (A) WB for the activation [phosphorylation (p)] of the sensor of unfolded proteins in the lumen of the ER, IRE1α, and of the molecular chaperone Grp78 in brain lysates of postnatal day 8 (P8), 3-wk-old (W3), and 20-wk-old (W20) Uch-l1d/d in comparison with Uch-l1+/+. Right graphs exhibit densitometric quantifications; 3 exp. n = 5–9; §§P < 0.01, §§§P < 0.001 (effect of genotype by two-way ANOVA). (B) Confocal images of pIRE1α (green), glial fibrillary acidic protein (GFAP, red), and DNA (blue) in cerebella of Uch-l1d/d in comparison with Uch-l1+/+ mice. Arrows: Purkinje cells. Note the enhanced signal for pIRE1α in the stratum granulosum in 3- and 20-wk-old Uch-l1d/d cerebella. (C) WB for Grp78 levels in primary neurons of Uch-l1d/d in comparison with Uch-l1+/+. Lower graph exhibits densitometric quantifications; 3 exp. n = 5–9; *P < 0.05 to Uch-l1+/+. WB for the mitochondrial membrane ATP synthase (ATPB) and the detoxifying enzyme manganese superoxide dismutase (MnSOD) in (D) brain lysates of postnatal day 8 (P8), 3-wk-old (W3), and 20-wk-old (W20) Uch-l1d/d; 3 exp. n = 5–15; and (E) in primary neurons of Uch-l1d/d in comparison with Uch-l1+/+. Graphs (D and E) exhibit densitometric quantifications; 3 exp. n = 8; §P < 0.05; *P < 0.05 to Uch-l1+/+, n.s., not significant. (F) Confocal images for ATBP in forebrain neurons of 3-wk-old Uch-l1d/d mice in comparison with Uch-l1+/+ mice. Arrows: Purkinje cells, note the enhanced signal for ATBP in Uch-l1d/d neurons.

