Fig. 2.
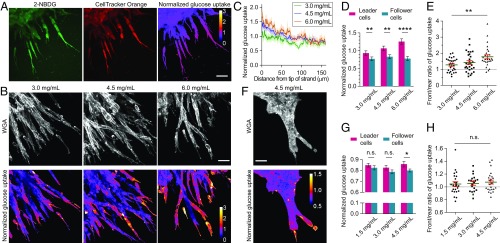
Glucose uptake along collectively invading strand in vitro and ex vivo. (A) Glucose uptake along invading strands in a representative spheroid is measured by the glucose analog 2-NBDG (green) and normalized to the CellTracker Orange CMRA dye (red) to obtain a ratiometric normalized glucose uptake value (heat map). (B) MDA-MB-231 leader cells exhibit higher normalized glucose uptake than follower cells as shown by the ratio heat maps alongside with wheat germ agglutinin (WGA) labeling of cell boundaries. (C) Normalized glucose uptake decreases along invading strands from tip to rear in vitro (averaged from n > 10 strands for each condition; shades represent s.e.). (D and E) The difference between leader and follower cells in normalized glucose uptake increases with collagen density in vitro (n = 29, 29, and 27, respectively; P = 0.0059, 0.0037, and <0.0001 from the paired t tests in D; P = 0.0035 from the ANOVA test in E). (F–H) Normalized glucose uptake is higher in leader cells than in follower cells during organoid invasion and exhibits a similar trend as collagen density increases (n = 24, 20, and 24, respectively; P = 0.32, 0.094, and 0.029 from the paired t tests in G; P = 0.78 from the ANOVA test in H). Strand tips orient toward the lower-right corner of the images. *P < 0.05, **P < 0.01, and ****P < 0.0001; n.s., not significant. (Scale bar, 50 µm.)

