Fig. 3.
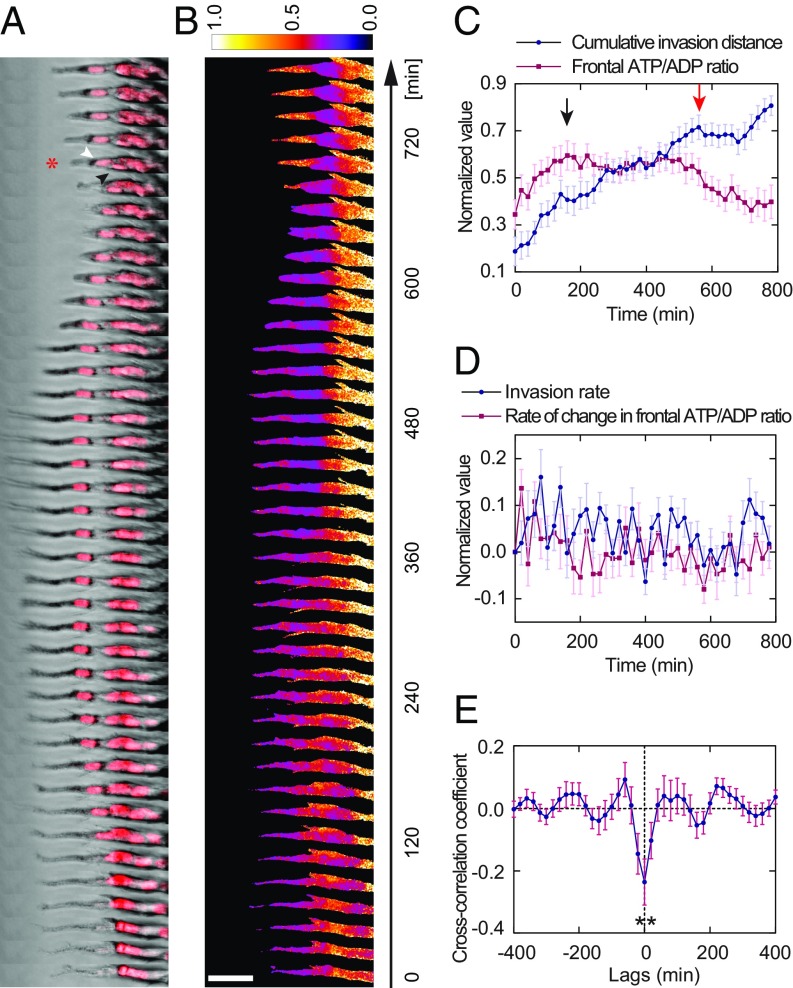
Dynamics of cellular ATP/ADP ratio correlates with leader cell invasion. (A) Time-series images of an leftward invading MDA-MB-231 strand with the PercevalHR ATP/ADP ratio sensor and DRAQ5 nuclear labeling (red) show a follower cell taking over the leader position (as indicated by the asterisk at 700 min; black arrowhead, old leader; white arrowhead, new leader). (B) Heat map of the same strand shows that the normalized ATP/ADP ratio correlates with leader cell invasion. The leader cell invades forward when the ATP/ADP ratio is high (0–160 min). As it invades, the ATP/ADP ratio drops because energy is being consumed (180–320 min). The original leader cell stops invading (340–480 min) and retracts (500–660 min) as the ATP/ADP ratio drops below a certain threshold. Leader–follower switching eventually takes place to sustain continued invasion (680–780 min). (C) Comparison of cumulative invasion distance and frontal ATP/ADP ratio (n = 21 strands; normalized to the range of [0, 1] for each strand) suggests that forward invasion of the leader cell depletes its ATP/ADP ratio (black arrow indicates the ATP/ADP ratio peak), causing invasion to stall (red arrow indicates a major retraction). (D) Rate of change in frontal ATP/ADP ratio and invasion rate of the strands frequently display opposite signs (n = 21 strands; normalized to the range of [0, 1] for each strand, which is then shifted to retain the signs of the variable before normalization). (E) Forward invasion depletes cellular energy as indicated by a negative correlation between the rates (n = 21 strands; P = 0.0043 from the one-sample t test compared with a value = 0). The ATP/ADP ratio in the frontal 25-µm segment of each strand is used to represent the leader cell ATP/ADP ratio. (Scale bar, 50 µm.)

