Fig. 1.
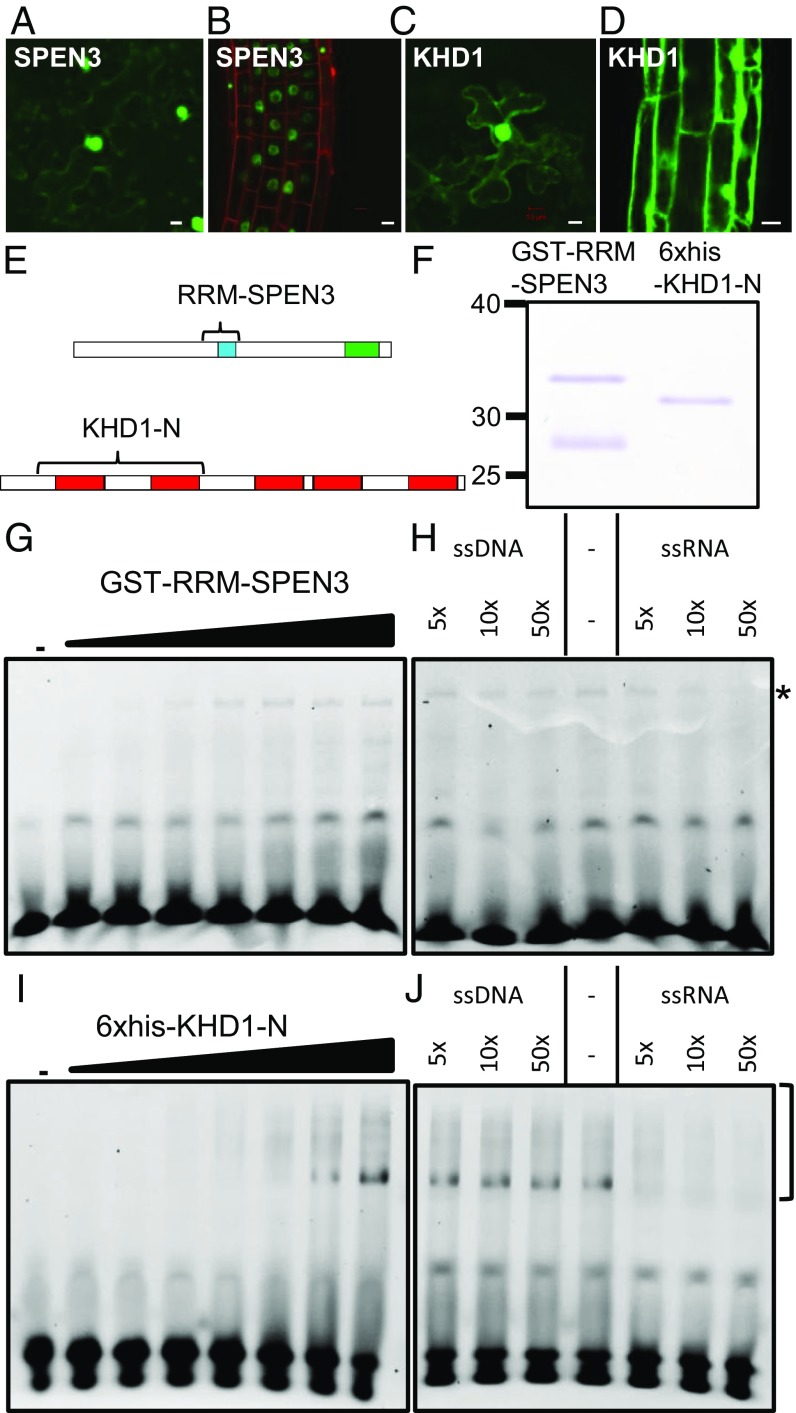
SPEN3 and KHD1 localization and RNA binding. (A–D) Detection of GFP::SPEN3 and GFP::KHD1 upon infiltration of N. benthamiana leaves (A and C) and stable transgenic A. thaliana roots (B and D). (Scale bars, 10 µm.) (E) Schemes of the SPEN3 and KHD1 proteins with their functional domains, RRM (blue), SPOC (green), and KH (red). Bracket indicates the part that was expressed in E. coli and purified for EMSA. (F) SDS/PAGE analysis of purified GST-RRM-SPEN3 and 6×His-KHD1-N proteins, stained with Coomassie brilliant blue. GST-RRM-SPEN3 is partially cleaved in E. coli and the band migrating below the fusion protein is free GST, as determined by MS. (G–J) Comparison of the binding of GST-RRM-SPEN3 (G) or 6×His-KHD1-N (I) to ssRNA, and competition assay with unlabeled ssRNA or ssDNA for analysis of GST-RRM-SPEN3 (H) or 6×His-KHD1-N (J). For titrations (G and I), the Cy3-labeled 25-nucleotide probe was incubated either in the absence (lane 1) or in the presence of increasing protein concentrations (0.1, 0.2, 0.5, 1, 2, 3, and 5 µM) (lanes 2–8, respectively). Samples were analyzed by PAGE. For competition assays, the Cy3-ssRNA 25-nucleotide probe was incubated with 3 µM of protein in all samples and binding to the labeled probe was competed (as indicated) with increasing concentrations of 25-bp ssDNA or ssRNA (5×, 10×, and 50× excess over Cy3-ssRNA). The bottom bands correspond to the unbound RNA and the asterisk or brackets indicate the protein–RNA complexes.

