Fig. 3.
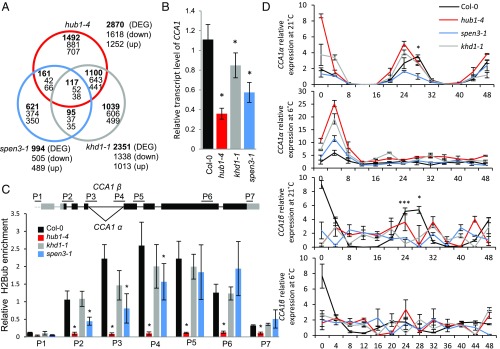
Transcriptomes, CCA1 transcripts, and H2Bub in mutants. (A) Venn diagram of the transcriptomes of the hub1-4, spen3-1, and khd1-1 expression profiles compared with Col-0. (B) Relative expression of CCA1 by qPCR in Col-0 and mutants in six biological replicates. (C) Scheme of the CCA1 gene structure with the splice forms CCA1α and CCA1β at intron 4 and position of the primers used in ChIP-qPCR (Upper). Relative enrichment of H2Bub at the CCA1 gene established with antibodies against H2Bub and four biological replicates used for ChIP assay (Lower). Results were normalized versus input samples. Error bars represent SDs (B and C) or SEs (D). Asterisks indicate statistically significant differences to Col-0 with the Student’s t test (*P < 0.05, B and C) or from spen3-1 to Col-0 (*P < 0.05, ***P < 0.001, D). (D) Relative expression in a 48-h time course experiment of the CCA1 splice forms, CCA1α and CCA1β, by qPCR at 21 °C and 6 °C in three biological replicates.

