Fig. 1.
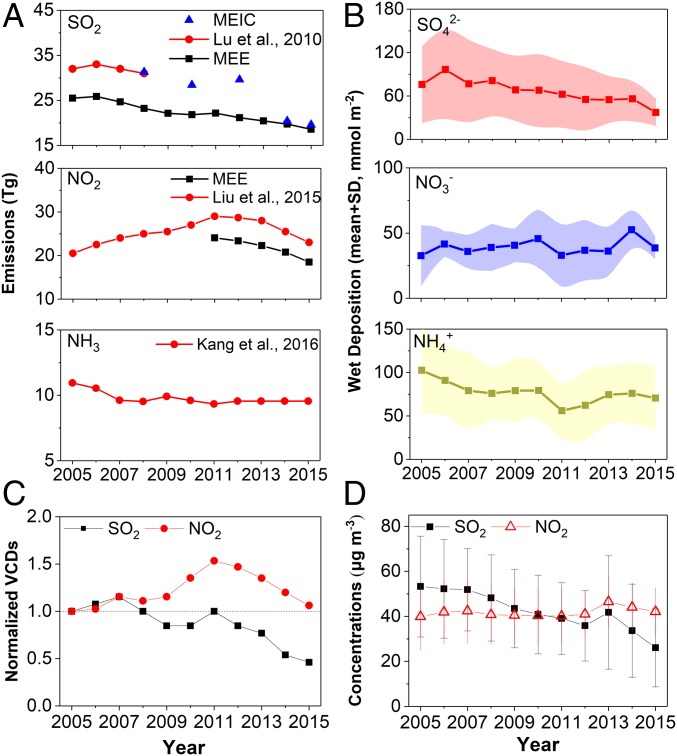
(A) Interannual trends in SO2, NOx, and NH3 emissions in China during 2005–2015. SO2 emissions were provided by the Ministry of Ecology and Environment of China (MEE; www.mee.gov.cn/), Lu et al. (35), and Multiresolution Emission Inventory for China; NOx emissions were derived from MEE and Liu et al. (12); and NH3 emissions were derived from Kang et al. (25). (B) Interannual trends in wet deposition (mean ± SD) of sulfate, nitrate, and ammonium averaged over four Acid Deposition Monitoring Network in East Asia stations (Jinyunshan, Shizhan, Xiaoping, and Xiangzhou) in China. (C) Normalized vertical column densities (VCDs) of SO2 and NO2 retrieved from ozone monitoring instrument measurements over China relative to the 2005 levels. (D) Ground-based concentrations of SO2 and NO2 averaged over 31 cities in China. These annual averaged values for each city were provided by the China Environmental Statistics Yearbook (www.stats.gov.cn/).

