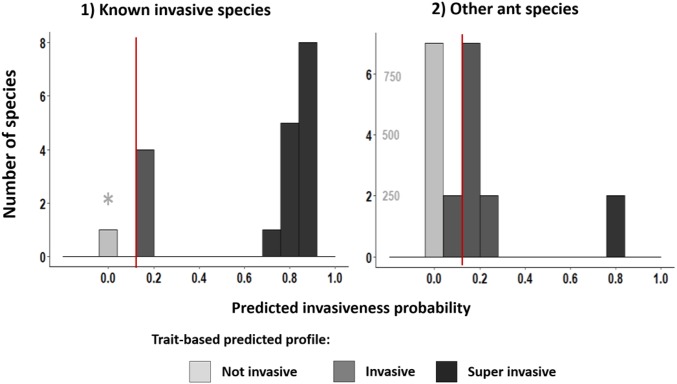
Fig. 1.
Predicted invasiveness probability distributions for (1) ant species recognized as invasive by IUCN and (2) ant species for which no information on invasive status exists. Dark gray bars on the right of the red lines correspond to superinvasive profiles, medium gray bars to invasive, and light gray bars to noninvasive. The asterisk (*) points to A. octospinosus, which the model shows to be wrongly classified as invasive by the IUCN. For the sake of clarity, the Right graph has two y axes: the light-gray axis corresponds to the light-gray bar of noninvasive species only.

