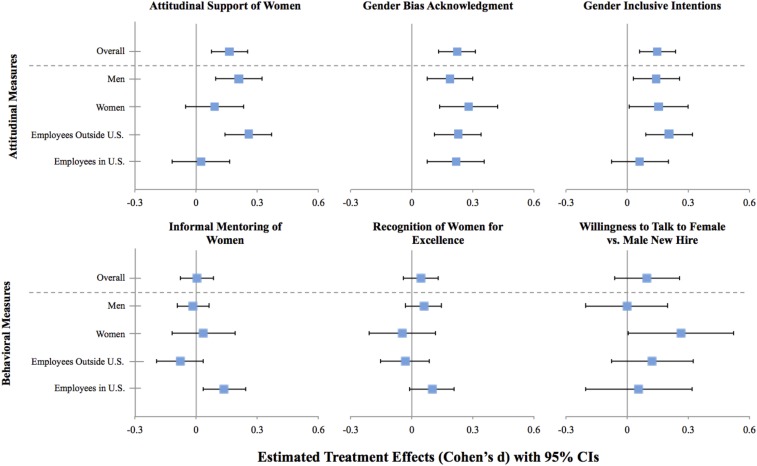
Fig. 1.
Summary of the intervention’s effect on outcome measures. Note: This figure summarizes the intervention’s effect on each of the attitude and behavior measures collected. Treatment effects (Cohen’s d) are estimated from ordinary least-squares regressions predicting the specified outcome measure using all interactions between the treatment, an indicator for the participant being male, and an indicator for the participant being located in the United States and fixed effects for office location, job category, and race. Mean differences are estimated via Wald tests, whereas pooled SDs are estimated via the root mean squared error from the regressions. Error bars reflect 95% confidence intervals.

