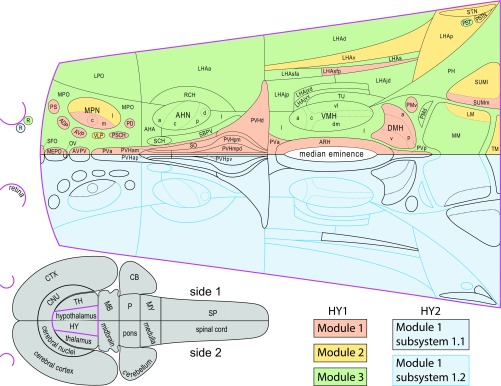
Fig. 3.
Comparison of bilateral (HY2) and unilateral (HY1) intrahypothalamic subsystems. (Top) Organization of within and between-sides (bilateral) top-level and second-level subsystems (HY2, Lower half of flatmap), and within-side (unilateral) top-level subsystems (HY1, Upper half of flatmap), for the hypothalamus macroscale subconnectome. To facilitate comparison, each bilaterally mirrored dataset is represented on one side of a flatmap of the rat hypothalamus (17)—the hypothalamus (magenta delineated) and its spatial relation to the CNS is represented on the gray flatmap at Lower Left. Top-level subsystems (modules) (for HY1 and HY2) and second-level subsystems (for HY2) are color coded (key at Lower Right). For HY1, there are six modules (three per side, as shown); for HY2, there are two bilateral modules (one shown). Each HY2 module (pastel blue) has two second-level subsystems: mostly medial HY2 subsystem 1.1 (black delineated) includes all regions in HY1 module 1 (pastel pink); mostly lateral HY2 subsystem 1.2 (blue delineated) includes all regions in HY1 module 3 (pastel green). HY1 module 2 (pastel yellow) includes fewer regions than the other HY1 modules, and these separate into one or the other HY2 second-level subsystem. Abbreviations are defined in Dataset S2.

