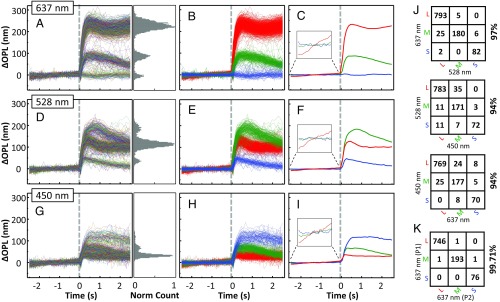
Fig. 3.
Phase response of cones varies with cone type (S, M, and L) and wavelength of the stimulus in subject 1. The dashed gray line at 0 s represents the 5-ms stimulus flash. Response traces of individual cones are shown for stimulation at (Upper) 637 nm and 1.6 μJ, (Middle) 528 nm and 0.5 μJ, and (Bottom) 450 nm and 1.0 μJ. (A, D, and G) Individual traces of 1,094 cone cells are randomly colored. Histogram of normalized cone count is shown for 0.6–1.0 s after flash. Average SD of individual S and M cone traces before stimulation was measured at 5 nm, which corresponds to the system noise floor. L cones were excluded from the analysis because their slight sensitivity to the imaging wavelength would have biased the measurement. Phase response was referenced to the average of the prestimulus volumes. (B, E, and H) Cone responses in A, D, and G are colored red (L), green (M), or blue (S) based on the k-mean classification and expected spectral sensitivity of each cone type to the stimulus wavelength. (C, F, and I) Average responses of the grouped traces in B, E, and H. (J) To quantify the agreement of our method to classify cones, three confusion matrices were constructed that show the number of cones that were classified as S, M, or L by one stimulus (450, 528, or 637 nm) and as S, M, or L by another stimulus (450, 528, or 637 nm). Percentage agreement is shown to the right of each matrix. (K) Repeatability error was quantified by comparing classification results of two independent subsets of videos (P1 and P2) obtained with the 637-nm stimulus. Each subset contains seven videos.

