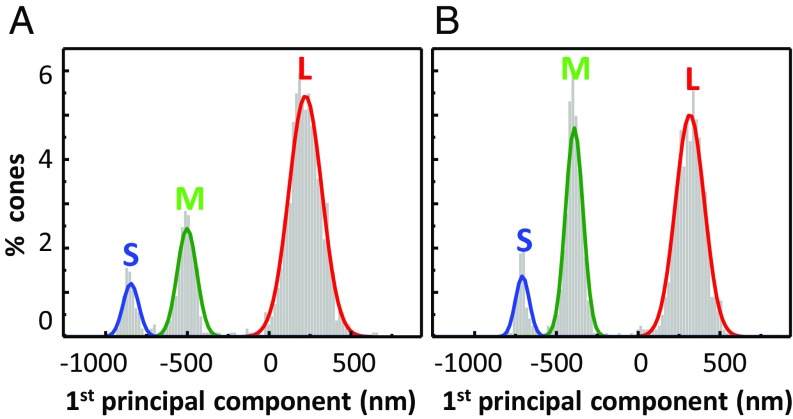
Fig. 5.
Cone classification uncertainty is less than 0.02%. (A and B) Distribution of the first principal component of ΔOPL traces for the two color-normal subjects as obtained from Fig. 3A and SI Appendix, Fig. S4A, using the 637-nm stimulus. Gaussian fits to the three clusters are color coded and identified by spectral type (S, M, L). Total cones in both plots equal 100%.

