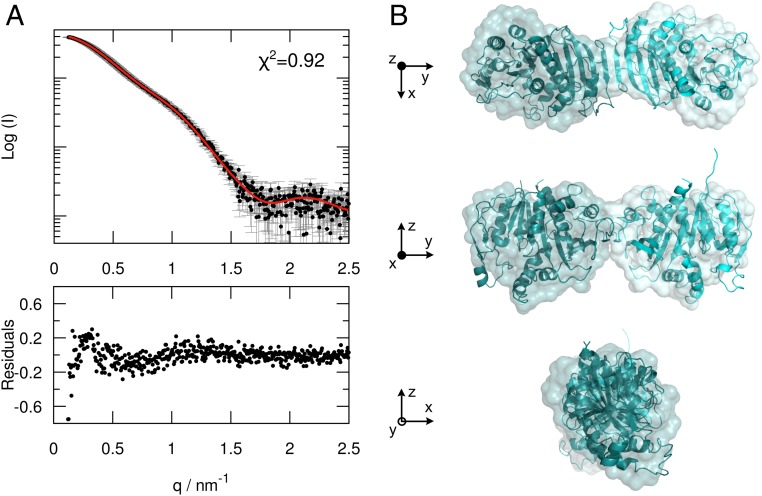
Fig. 3.
SAXS analysis of CrPRK. (A, Upper) Superimposition of the experimental SAXS profile (black) and the theoretical SAXS curve (red), calculated from the CrPRK crystal structure. (A, Lower) The residuals obtained by the difference between the experimental and calculated intensities. (B) Comparison between the ab initio model (surface representation) and the crystal structure (ribbon representation) of CrPRK, showing an excellent agreement between the two models.

