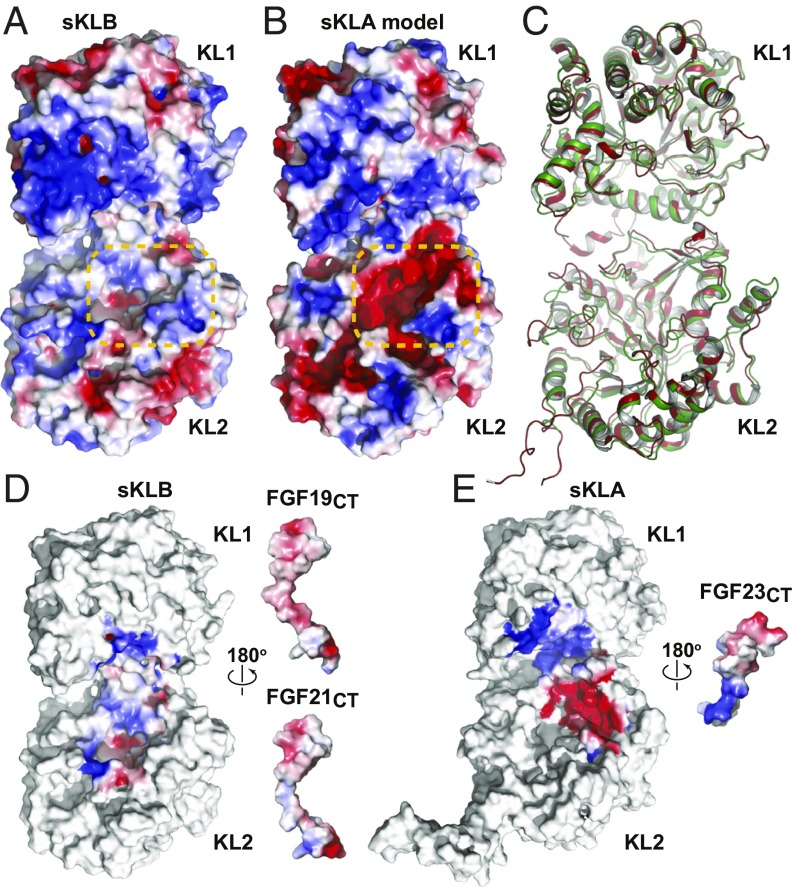
Fig. 4.
Homology model of sKLA built based on the crystal structure of the sKLB:FGF21CT complex. Electrostatic potentials of (A) sKLB (PDB ID: 5VAQ, chain A) and (B) homology model of sKLA are color-coded on the surface representation. Site 2 areas that exhibit a major difference in electrostatic potentials are highlighted with orange dashed lines. (C) Comparison of crystal structures of sKLB and sKLA. Coordinates of the sKLB molecule from the sKLB:FGF19CT:Nb30 structure (this work) are overlaid with the coordinates of the sKLA molecule from the sKLA:FGF23:FGFR1cD2D3 structure (PDB ID: 5W21) with an overall Cα rmsd of 1.17 Å. Only sKLB (green) and sKLA (red) are shown for clarity. (D and E) Electrostatic complementarity of ligand–Klotho interactions in site 2 may determine ligand specificities. Open-book representations of (D) sKLB:FGF21CT (PDB ID: 5VAQ) and sKLB:FGF19CT (this work) and (E) sKLA:FGF23CT (PDB ID: 5W21) showing surface electrostatic potentials of regions in which ligand–Klotho interactions occur. Note that coordinates of missing FGF19 residues (G205-A208) in the sKLB:FGF19CT structure were built using the crystal structure of sKLB:FGF21CT (PDB ID: 5VAQ) to examine electrostatic complementarity.

