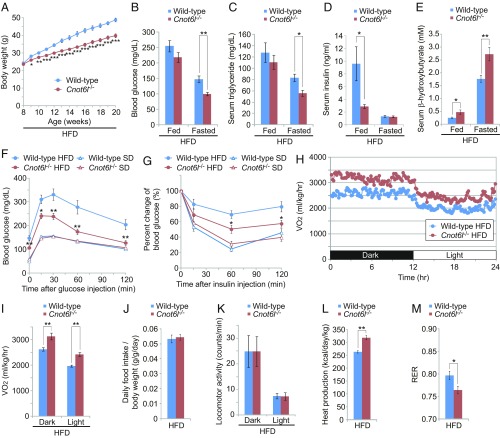
Fig. 4.
Protection from diet-induced metabolic disorders and enhanced energy expenditure in Cnot6l−/− mice. (A) Growth curve of wild-type and Cnot6l−/− mice fed on an HFD. HFD feeding started at 8 wk of age. n = 14–17 per group. (B–E) Levels of blood glucose (B), serum triglycerides (C), serum insulin (D), and serum β-hydroxybutyrates (E) in wild-type or Cnot6l−/− mice fed on an HFD during ad libitum feeding or fasting. n = 7–10 per group. (F and G) Intraperitoneal glucose tolerance tests (GTTs) (F) and insulin tolerance tests (ITTs) (G) in wild-type and Cnot6l−/− mice fed on an HFD or standard diet (SD). Blood glucose levels were measured at the indicated time points following intraperitoneal injection of glucose or insulin. n = 7–10 per group. *P < 0.05, **P < 0.01 for Cnot6l−/− on HFD versus wild-type on HFD. (H and I) Oxygen consumption (VO2) over 24 h (H) and average VO2 (I) in wild-type and Cnot6l−/− mice fed on HFD. VO2 were normalized to body weight. n = 5 per group. (J–M) Daily food intake per body weight (J), locomotor activity (K), calculated heat production (L), and respiratory exchange ratio (M) in wild-type and Cnot6l−/− mice fed on an HFD. n = 5 per group. Data represent mean ± SEM. *P < 0.05, **P < 0.01, ***P < 0.001; two-way ANOVA with Tukey’s post hoc test for A–G and I and Student’s t test for J–M.

