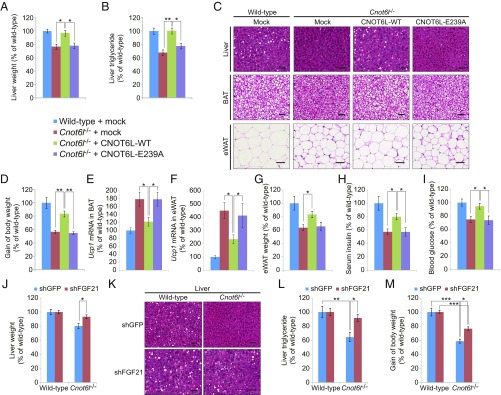
Fig. 6.
Systemic regulation of whole-body metabolism by the CCR4–NOT/FGF21 axis. (A–I) Liver weight (A), liver triglyceride contents (B), representative H&E staining of the liver, BAT, and eWAT (C), gain of body weight (D), Ucp1 mRNA level in BAT (E) and eWAT (F), eWAT weight (G), serum insulin (H), and blood glucose levels (I) of wild-type and Cnot6l−/− mice injected with adenovirus expressing EGFP, CNOT6L-WT, or CNOT6L-E239A. Ten-week-old mice were administered with adenovirus and fed on HFD for 2 wk. (Scale bars, 50 μm.) Liver triglyceride contents were normalized to liver weight. n = 7–8 per group. (J–M) Liver weight (J), representative liver H&E staining (K), liver triglyceride contents (L), and gain of body weight (M) of wild-type and Cnot6l−/− mice injected with adenovirus expressing control (shGFP) or Fgf21 shRNA (shFGF21). Ten-week-old mice were injected with adenovirus and fed on HFD for 2 wk. (Scale bars, 50 μm.) Liver triglyceride contents were normalized to liver weight. n = 10 per group. Data represent mean ± SEM. *P < 0.05, **P < 0.01, ***P < 0.001; two-way ANOVA with Tukey’s post hoc test.

