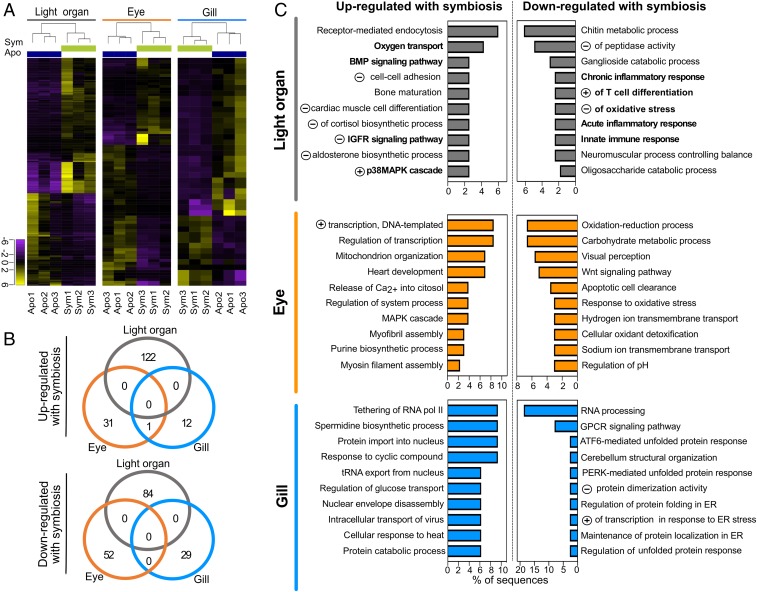
Fig. 2.
Impact of light-organ symbiosis on gene expression in different adult organs. (A) Heat map of expression values, log2-transformed and median centered, for genes significantly differentially expressed (>twofold, Padj < 0.05) in adult light organ, eye, and gill. Apo: aposymbiotic, in dark blue; Sym: symbiotic (colonized by wild-type V. fischeri) in green. (B) Venn diagrams indicating the numbers of significantly differentially expressed genes (>twofold, Padj < 0.05) in response to symbiosis. (C) Functional annotation of symbiosis-responsive genes in remote tissues. The differentially expressed genes were enriched in functional categories based on GO annotation. The top 10 enriched biological processes are shown ordered by percentages of sequences with that function and by its significance level (Fisher’s exact test, FDR < 0.05). “Negative (or positive) regulation of…” is abbreviated by a circled minus (or plus) symbol. Complete GO-term names and codes are in Dataset S6. Bold lettering indicates GO terms described in Results.

