Fig. 4.
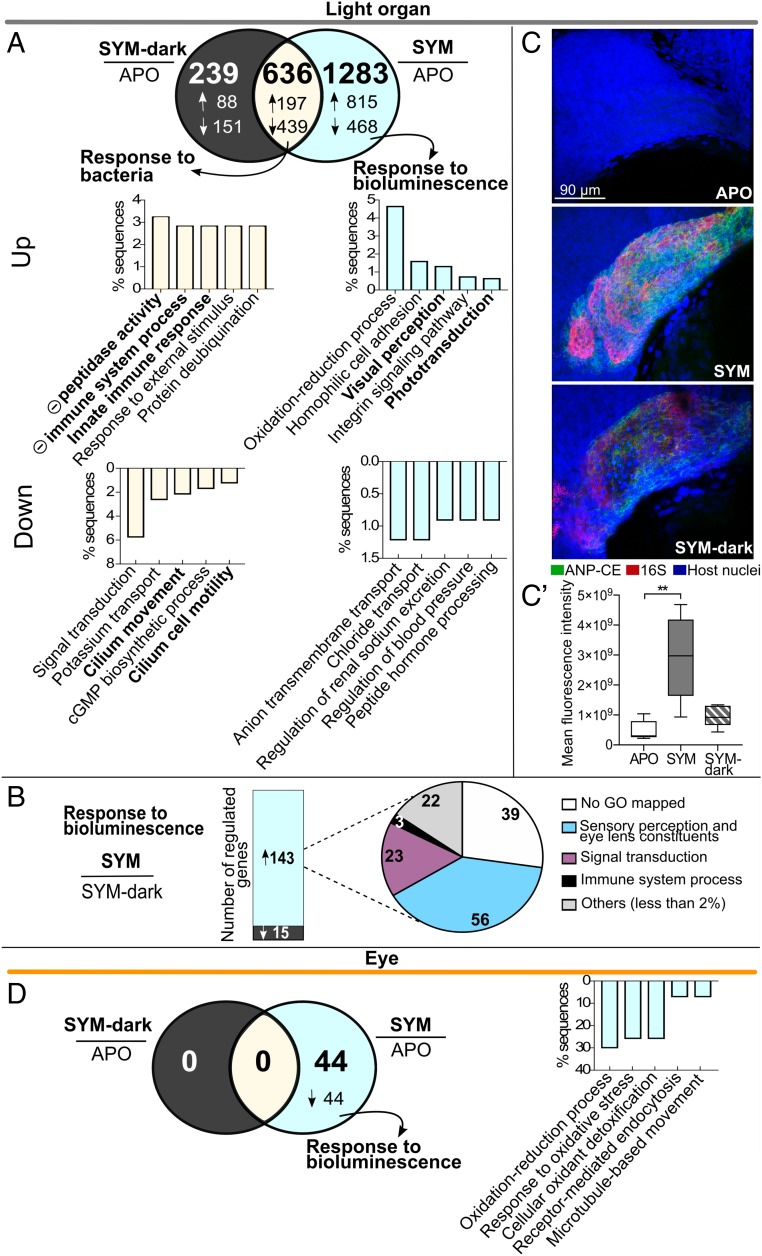
Impact of symbiont bioluminescence on juvenile gene expression. (A) Venn diagram of numbers of differentially expressed genes in the light organ, 24 h after colonization by either SYM (wild-type) or SYM-dark (Δlux) strains, compared with APO (>twofold, Padj < 0.05). Arrows indicate either up (↑) or down (↓) regulation. Bar graphs: functional enrichment of genes significantly up-regulated and down-regulated with symbiosis. For each set, the top five biological process terms are represented (Fisher’s exact test, FDR < 0.01). Notations as in Fig. 2. (B, Left) number of genes significantly up- or down-regulated in SYM compared with SYM-dark colonized light organs; (Right) proportion of annotated biological processes accounting for >2% of up-regulated genes. (C) Visualization of ANP-CE transcript in whole-mount light organs 24 h after colonization. Representative confocal images showing ANP-CE expression in crypt epithelium of APO, SYM, or SYM-dark colonized juvenile squid; merged midsection of z-stack of crypt #1; ANP-CE (green), 16S RNA (symbionts, red), and host nuclei (TOPRO, blue) (SI Appendix, Fig. S10 and Movies S1–S3). (C′) Quantification of ANP-CE signal by fluorescence intensity from z-stacks of crypt #1 in five light organs. P values were calculated using Kruskal–Wallis test and Dunn's multiple comparison test. Error bar: SD (**P < 0.01). (D) Venn diagram of differentially expressed genes in the eye, 24 h after colonization by either SYM (wild-type) or SYM-dark (Δlux) strains, compared with APO (>twofold, Padj < 0.05). Arrow indicates down (↓) regulation. Bar graph: notations as in A (Datasets S8 and S9).

