Fig. 4.
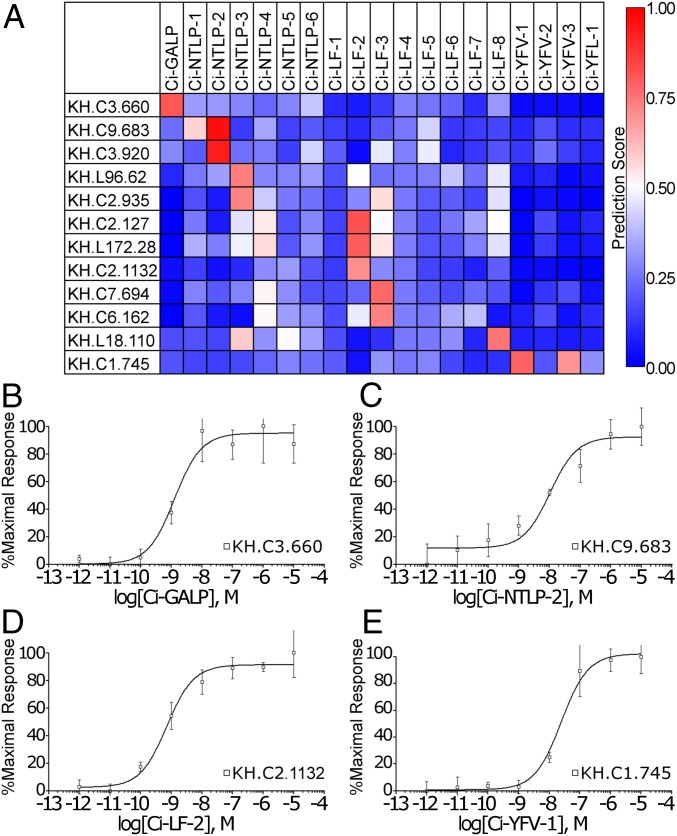
GPCRs for Ci-GALP, Ci-LF-2, Ci-NTLP-2, and Ci-YFV-1 were identified by signaling assays based on the prediction by PD-incorporated SVM. (A) Prediction results for C. intestinalis CPIs are shown as a heat map. The color gradient represents the predicted value for each interaction between peptide and GPCR. Only GPCRs that were predicted to interact with at least one peptide with prediction scores higher than 0.7 are shown. Dose-dependent responses of (B) Ci-GALP, (C) Ci-NTLP-2, (D) Ci-LF-2, and (E) Ci-YFV-1 in Sf-9 cells expressing each receptor were assessed with intracellular Ca2+ mobilization, and sigmoid curves were calculated using Prism 3.03. Error bars represent the SEM of more than three experiments.

