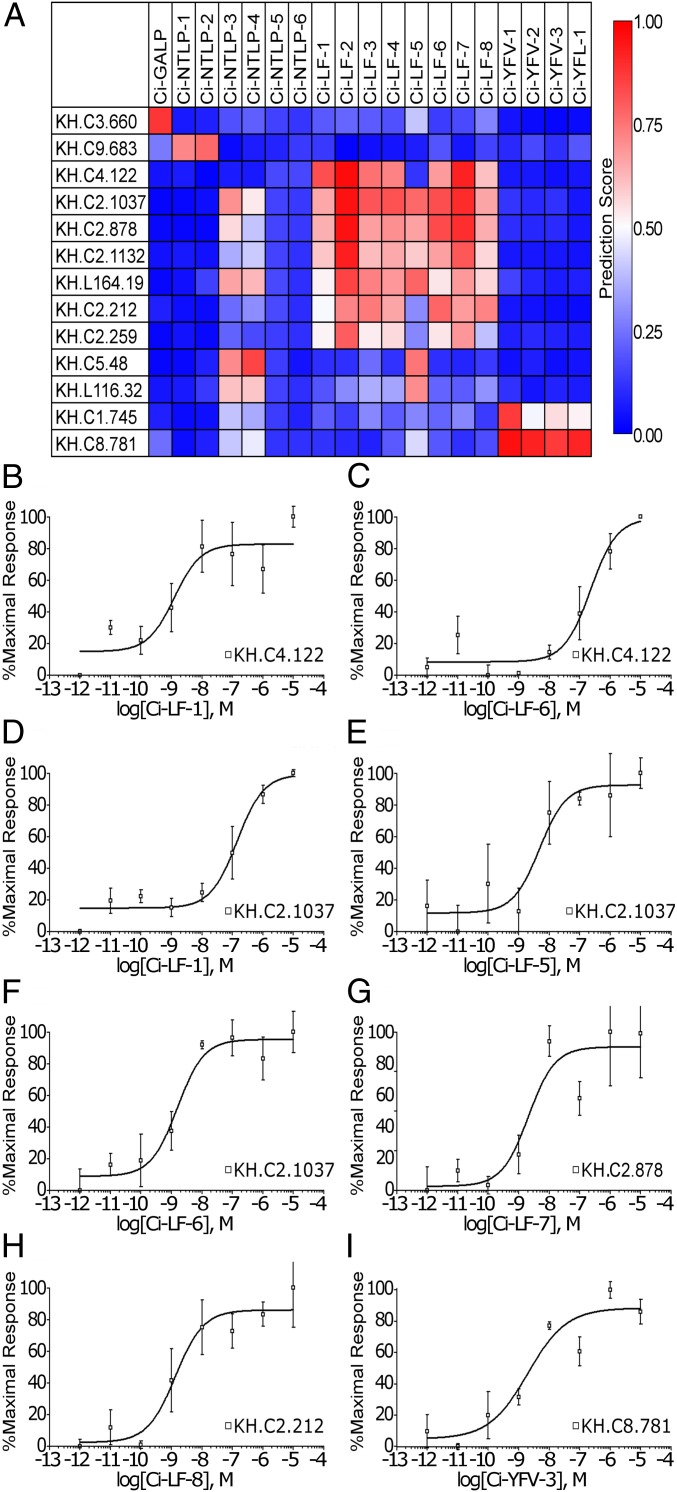
Fig. 5.
Data feedback of experimentally validated results of four Ciona neuropeptide–GPCR pairs, leading to the identification of eight additional pairs. (A) Prediction results for C. intestinalis CPIs are shown as a heat map. The color gradient represents the predicted value for each interaction between peptide and GPCR. Only GPCRs that were predicted to interact with at least one peptide with prediction scores higher than 0.7 are shown. Dose-dependent responses of (B and D) Ci-LF-1, (E) Ci-LF-5, (C and F) Ci-LF-6, (G) Ci-LF-7, (H) Ci-LF-8, and (I) Ci-YFV-3 in Sf-9 cells expressing each receptor were assessed with intracellular Ca2+ mobilization, and sigmoid curves were calculated using Prism 3.03. Error bars represent the SEM of more than three experiments.

