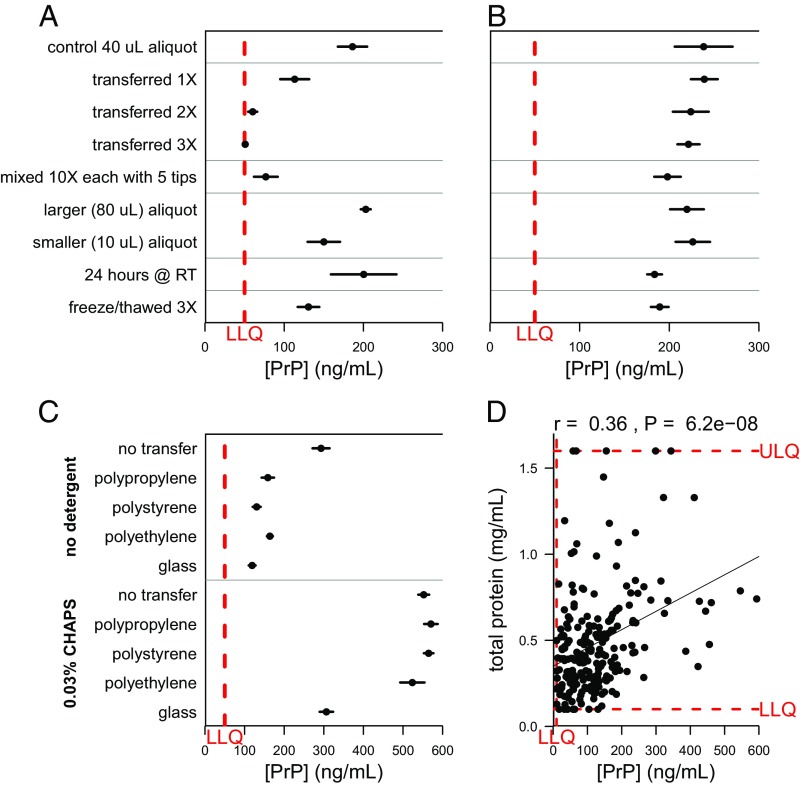
Fig. 1.
Storage and handling can dramatically reduce the amount of PrP detected in CSF samples unless appropriate measures are taken. In A–C, dots represent mean and line segments represent 95% confidence intervals across four to seven aliquots of the same sample, each measured in duplicate at a 1:50 dilution. (D) Dots represent mean of measurements within dynamic range, among 2 dilutions with 2 technical replicates each. (A) Increased polypropylene exposure substantially reduces detectable PrP. (B) Addition of 0.03% CHAPS detergent to samples increases PrP recovery and consistently mitigates PrP loss to plastic. (C) Addition of CHAPS (Bottom) increases total PrP recovery and shows similar rescue across plastics, but substantial PrP loss is still observed on storage in glass. (D) Across 217 CSF samples, total protein levels and PrP levels were modestly correlated (Spearman’s rank correlation coefficient = 0.36; P = 6.2 × 10⁻⁸). (A–C) Dots represent mean and line segments represent 95% confidence intervals across four to seven aliquots of the same sample, each measured in duplicate at a 1:50 dilution. (D) Dots represent mean of measurements within dynamic range, among two dilutions with two technical replicates each.

