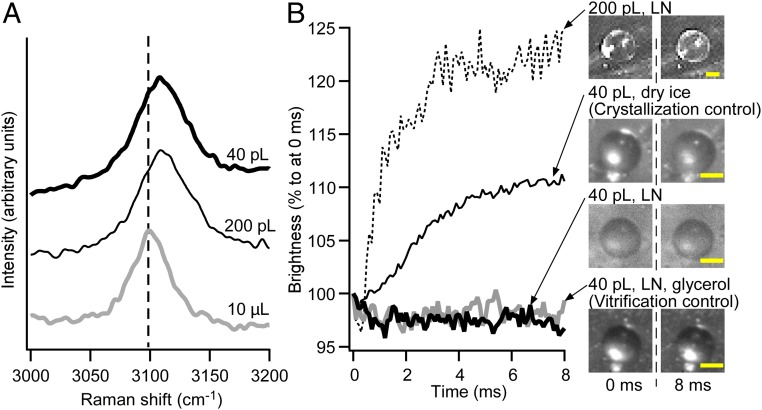
Fig. 3.
Experimental assessment of the freezing states of the droplets. (A) Raman spectra for 10-μL, 200-pL, and 40-pL droplets. A peak at ∼3,100 cm−1 was assigned to the OH stretching vibration, which shifts toward the low-frequency region in the vitreous state. The peaks of both inkjet-printed droplets shifted by ∼20 cm−1 relative to that of the 10-μL droplet (vertical dotted line). (B) Time course of the brightness of the droplets frozen under varying conditions. The moment when the droplet was deposited on the substrate was defined as 0 ms. The 200-pL droplet brightened within 3 ms after the deposition. The 40-pL droplet deposited on the substrate that was cooled with dry ice exhibited slightly increased brightness. The 40-pL droplets deposited on the LN-cooled substrate exhibited constant brightness regardless of the presence or absence of glycerol. (Scale bars, 25 μm.)

