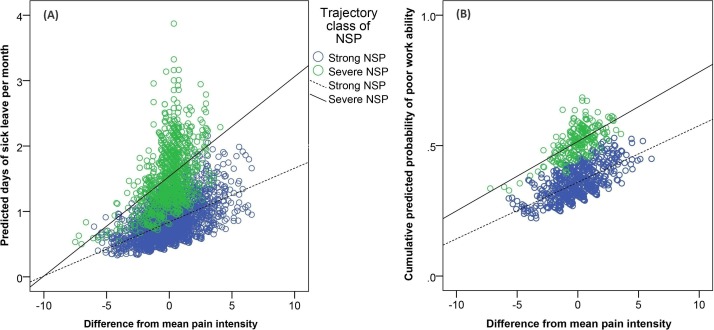
Figure 2.
Association between temporal fluctuations in neck–shoulder pain (NSP) intensity and the outcomes sick leave and work ability. The x-axis represents the difference in pain intensity scores from the person mean pain intensity across time points. The y-axis represents the predicted number of days on sick leave per month (A) and the predicted cumulative probability of poor work ability (B), as defined by the cut-point ≤7 (scale 0–10).39

