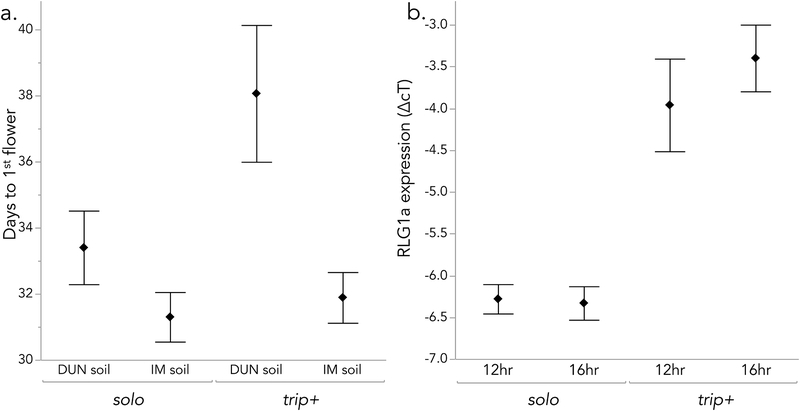
Figure 3.
Flowering time and expression of RLG1a genotypes (solo, trip+) under controlled conditions. a) Time to first flower (mean ± 1 SE) for outbred plants grown in two field soils (DUN = drier; see Methods) in greenhouse. Analyzed with ANOVA (overall r2 = 0.21, n = 79). Soil type effect: P < 0.001; RLG1a genotype effect: P = 0.03; interaction: P = 0.09). b. RLG1a expression (relative to EF1a control; mean ± 1 SE) in leaf tissue of solo (N = 9) and trip+ (N =2) inbred lines grown under two daylength conditions. Analyzed with nested ANOVA (overall r2 = 0.78, n = 56): Daylength effect: p = 0.58; RLG1a CNV effect: p < 0.0001; Line nested within genotype effect; p = 0.002)

