
Figure 3.
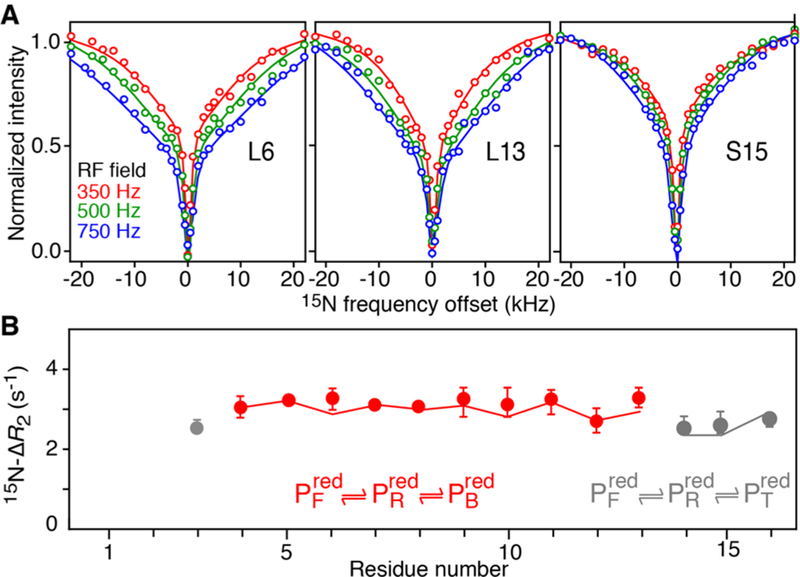
Kinetics of httNT binding to TiO2 NPs characterized by relaxation-based NMR. (A) Examples of 15N-DEST profiles and (B) 15N-ΔR2 as a function of residue observed for 300 μM 15N-labeled httNT in the presence of 5 g·L−1 TiO2 NPs in the dark. Circles represent experimental data, and solid lines are best fits to a three-state exchange model. Residues requiring a separate treatment are shown in gray. Data were recorded at 600 MHz and 10 °C.