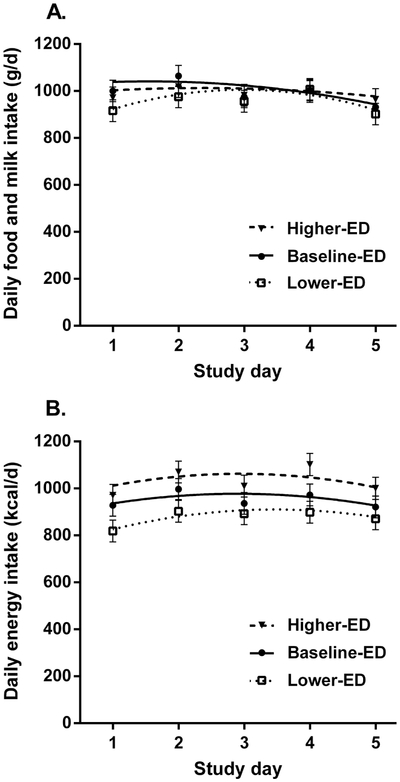
FIGURE 1.
Mean (±SEM) daily intake across time according to the (A) weight and (B) energy consumed by 49 preschool children who over 3 different 5-day periods were served multiple lower-energy density (ED), baseline-ED, and higher-ED foods. Mean daily intakes and trajectories are from mixed models that were adjusted for study week, menu, classroom, and sex. A random coefficients model showed that the pattern of daily intake over 5 days did not differ between conditions for weight (P=0.19) or energy (P=0.94), indicating intake was not adjusted in response to changes in ED. Thus, increases and decreases in energy intake from the baseline-ED condition were sustained over time.

