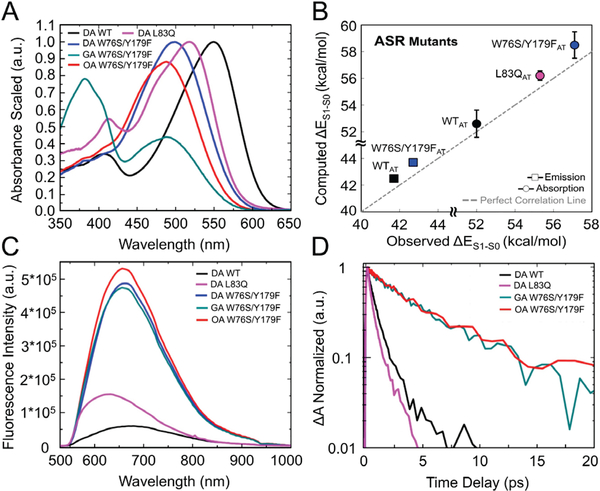
Figure 2.
Steady state spectra and excited states dynamics. (A) Scaled absorption spectra of light-adapted (OA and GA) W76S/Y179F mutant and dark-adapted (DA)WT, W76S/Y179F and L83Q mutants of ASR. Light-adaptation was carried out either with an orange or green LED. (B) Comparison between simulated all-trans and observed λamax (circles) and λfmax (squares) values for the DA state. Deviation bars for the computed excitation energy values are shown as black segments. The excitation energy errors fall in the 0.5–1.5 kcal/mol range typical of ARM22. (C) Steady state emission of DA WT ASR, DA L83Q ASR, DA, OA and GA W76S/Y179F mutant of ASR. (D) Comparison of the SE kinetic traces of WT (black trace), L83Q (pink trace) and W76S/Y179F (GA green trace and OA red trace).

