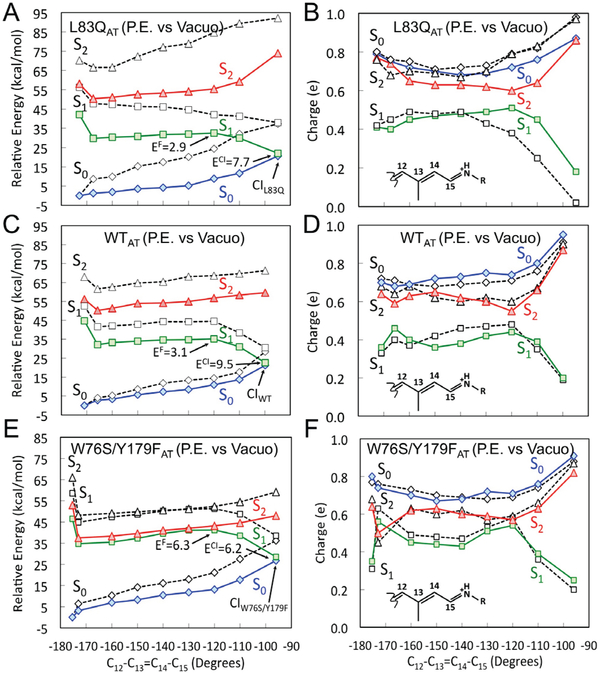
Figure 6.
Energy profiles along the S1 isomerization paths of Figure 3 for the chromophore in vacuo. (A), (C) and (E) CASPT2//CASSCF/AMBER energy profiles for the S1 state (green squares) of L83Q, WT and W76S/Y179F respectively. S0 (blue diamonds) and S2 (red triangles) profiles along the same path. (B), (D) and (F) corresponding Mulliken charge variation of the −CH−CH−CH−CH−NH2 moiety of the chromophore of L83Q, WT and W76S/Y179F respectively. In all panels the dashed energy profiles represent the corresponding energy profiles of the entire protein models (i.e. from Figure 3).

