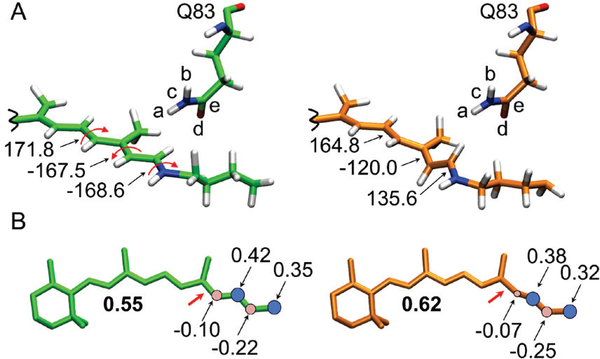
Figure 7.
Geometrical and charge distribution variations along the S1 isomerization path of L83Q (see Figure 3A). (A) Geometrical variation documented by three critical dihedral angles (curly arrows). The left structure corresponds to the second point along the energy profile of Figure 3A (i.e. the point corresponding to MINWT and MINW76S/Y179) while the right structure is the “transition state” structure featuring a −120º C12-C13=C14-C15 dihedral angle. (B) Charge distribution data for the same two structures.

