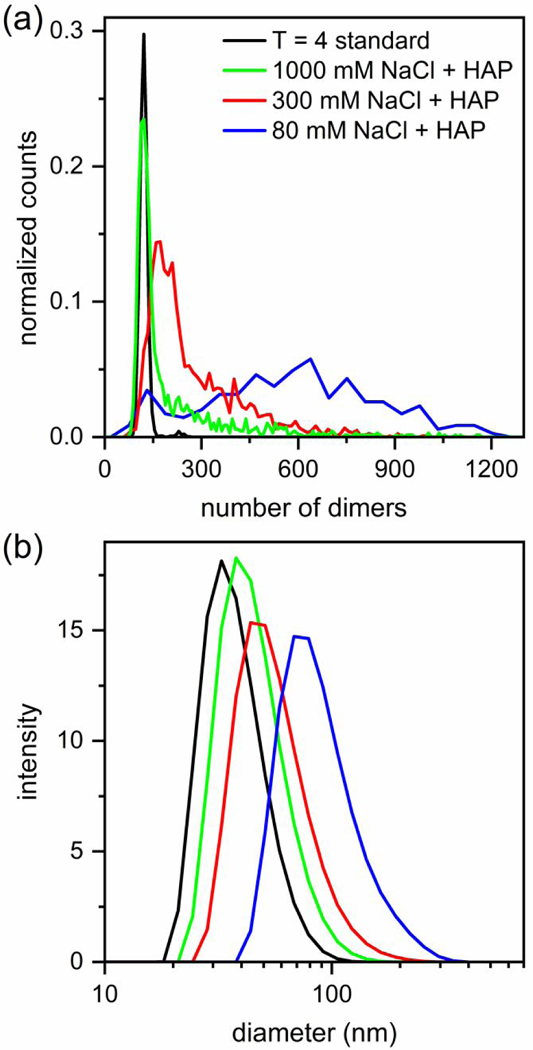
Figure 4. Bimodal distribution of assembly products from competition of two alternative assembly pathways.

Histograms of assembly reactions of 5 μM Cp dimer with 20 μM HAP-TAMRA and 1000, 300, and 80 mM NaCl in 50 mM HEPES (pH 7.5). Assembly at low ionic strength, 80 mM NaCl, yields a bimodal distribution with centers at ~120–140 and ~600 dimers. The number of measured particles is ~200 for assembly at 80 mM NaCl and > 900 for 300 and 1000 mM NaCl. The histograms were normalized to the same area, and then, scaled for clarity. (b) Dynamic light scattering (DLS) data with mean diameters of 35 nm for T = 4 capsids, and 40, 50, and 80 nm for assembly reactions in 20 μM HAP-TAMRA with 1000, 300, and 80 mM NaCl, respectively. DLS data provide a view that contains less information than the resistive-pulse sensing, but the conclusions remain broadly consistent.
