
Figure 7. Model of spherical growth consistent with particle morphology.
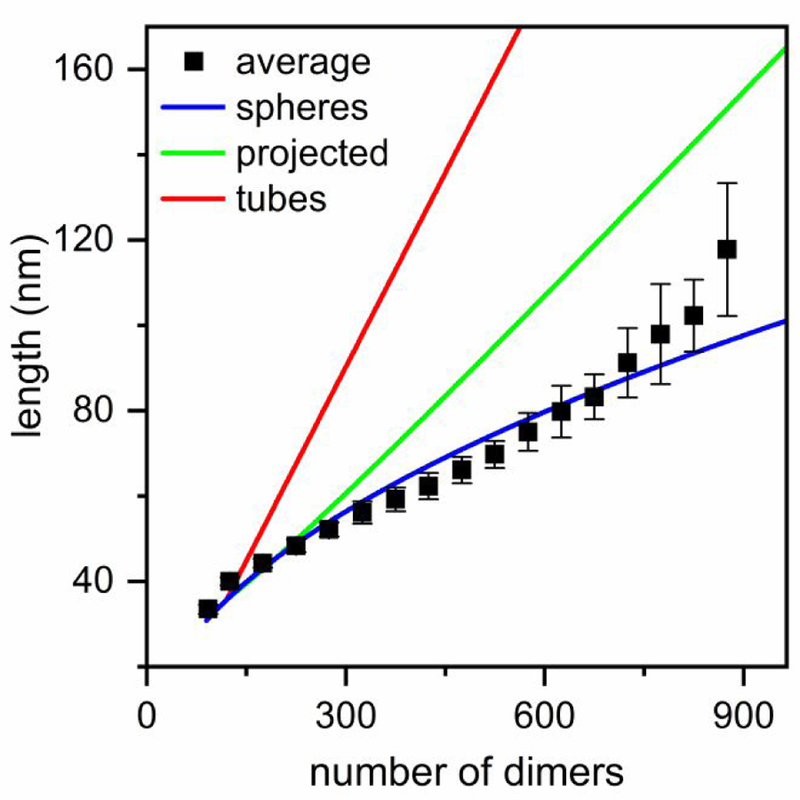
Average particle lengths fitted with models of spherical growth and linear growth of tubes. The pulse width measurements in Figure 5b were converted to particle length with T = 3 and T = 4 capsids as calibration standards. The spherical growth model (blue) yielded the best fit and assumes that particles grow by forming closed spheres, but as particle diameters approach the nanopore dimensions, the model begins to fail. The linear growth of tubes model (red) shows the longer dimension of tube length, whereas the green shows the mean projected length on the translocation axis if the tubes rotate freely as they travel through the pores. Particles were assembled from 5 μM Cp dimer with 20 μM HAP-TAMRA and 300 mM NaCl in 50 mM HEPES (pH 7.5).