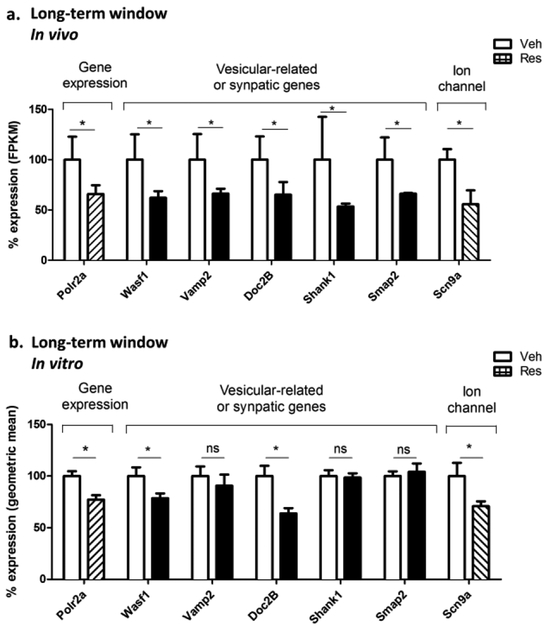
Fig. 3. The in vitro model of RPC-induced long-term ischemic tolerance recapitulates in vivo transcriptomic changes.
a. The percent mRNA levels for the differentially expressed genes as revealed by RNA-seq analysis performed on the cortex of mice 2 weeks post RPC (n=3). b. The percent mRNA levels for the same genes as revealed by real-time PCR analysis performed at 6 days post RPC using the in vitro rat neuronal-astrocytic co-culture model. (n=7; paired Student’s t.test; ns not significant; * p<0.05).

