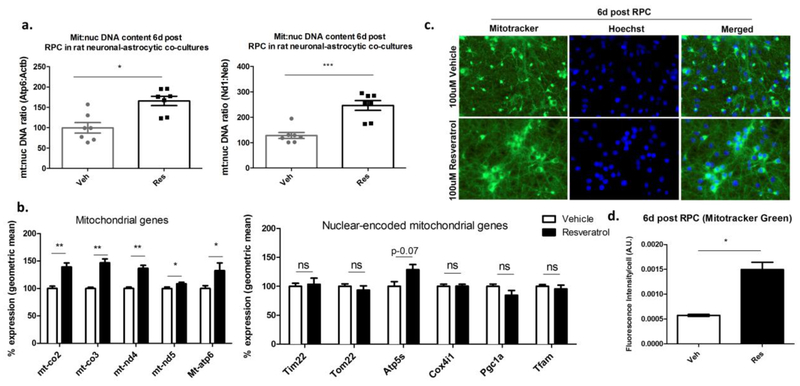
Fig. 5. RPC increases the mitochondrial abundance of the rat neuronal-astrocytic co-cultures within the long-term window of ischemic tolerance.
a. Measuring the mitochondrial to nuclear DNA ratio using real-time PCR analysis with two rat-specific primer sets that uniquely amplify mitochondrial (Atp6, Nd1) or nuclear (Actb, Neb) DNA at the six day time point post RPC (n=7; paired Student’s t.test; * p<0.05, *** p<0.001). b. Measuring the mRNA levels of mitochondrial- or nuclear- encoded genes involved in oxidative phosphorylation (Mt-co2, Mt-co3, Mt-nd4, Mt-nd5, Atp5s, Mt-Atp6, Cox4i1), import of proteins to the mitochondria (Tim22, Tom22), or mitochondrial biogenesis (Pgc1α, Tfam) (n=5–7; paired t-test; ns not significant, * p<0.05, ** p<0.01, *** p<0.001). c. Representative fluorescent images of live neuronal-astrocytic co-cultures stained with Mitotracker Green and Hoechst at the six day time point post-RPC (40X magnification). d. Quantification of the fluorescence intensity of the Mitotracker green stained cells normalized to cell number (n=3; paired Student’s t-test; * p<0.05).

