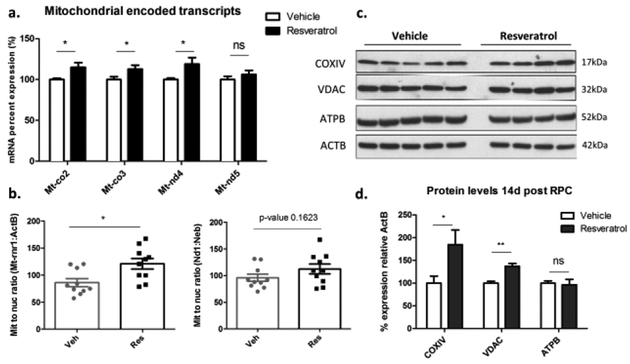
Fig. 6. RPC increases mitochondrial abundance in the mouse cortex within the long-term window of ischemic tolerance.
a. Measuring the mRNA levels of mitochondrial-encoded genes involved in oxidative phosphorylation (Mt-co2, Mt-co3, Mt-nd4, Mt-nd5) in the mouse cortex two weeks post RPC (n=10; paired Student’s t-test; ns not significant, * p<0.05). b. Measuring the mitochondrial to nuclear DNA ratio using real-time PCR analysis with two mouse-specific primer sets that uniquely amplifies the mitochondrial (Mt-rnr1, Nd1) or nuclear (Actb, Neb) DNA at the two-week window post RPC (n=10; paired Student’s t.test; * p<0.05). c. Western blot analysis showing the protein levels of COXIV, VDAC, ATPB, and ACTB in the mouse cortex two weeks post RPC. d. Quantification of the western blot results of COXIV, VDAC, and ATPB relative to ACTB (n=4–5; Student’s t-test; ns not significant, * p<0.05, ** p<0.01).

