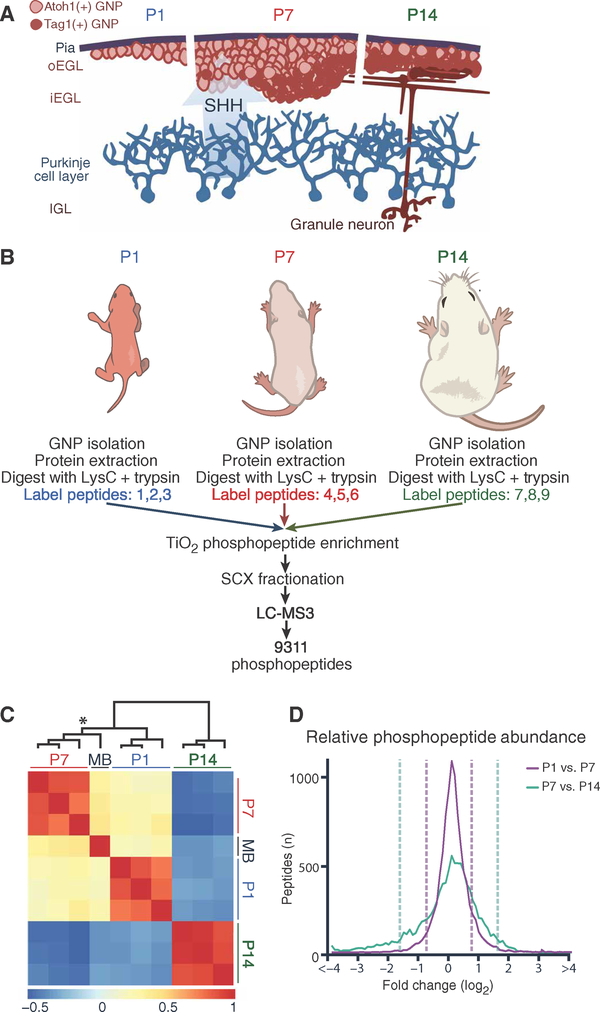
Fig. 1. Quantitative mapping of the phosphoproteome during GNP development.
(A) Schematic of early postnatal proliferation and differentiation of GNPs. Pink, Atoh1-positive proliferative GNPs; red, postmitotic GNPs. oEGL/iEGL, outer/inner external granule layer; IGL, internal granule layer. (B) Experimental scheme for the phosphoproteomic assays. (C) Heat map representing relative phosphopeptide abundance and undirected clustering among three biological replicates and sample types (P1, P7, and P14 GNPs and Ptch+/− MB). Color axis = R2. *Cluster branch of P7 GNPs versus MB sample. (D) Distribution of relative phosphopeptide abundance at developmental transitions. Dashed lines = 1.5 SDs. Mass spectrometry (MS) was performed in n = 3 biological replicates per experimental time point (14 to 40 mice per replicate at each time point).

