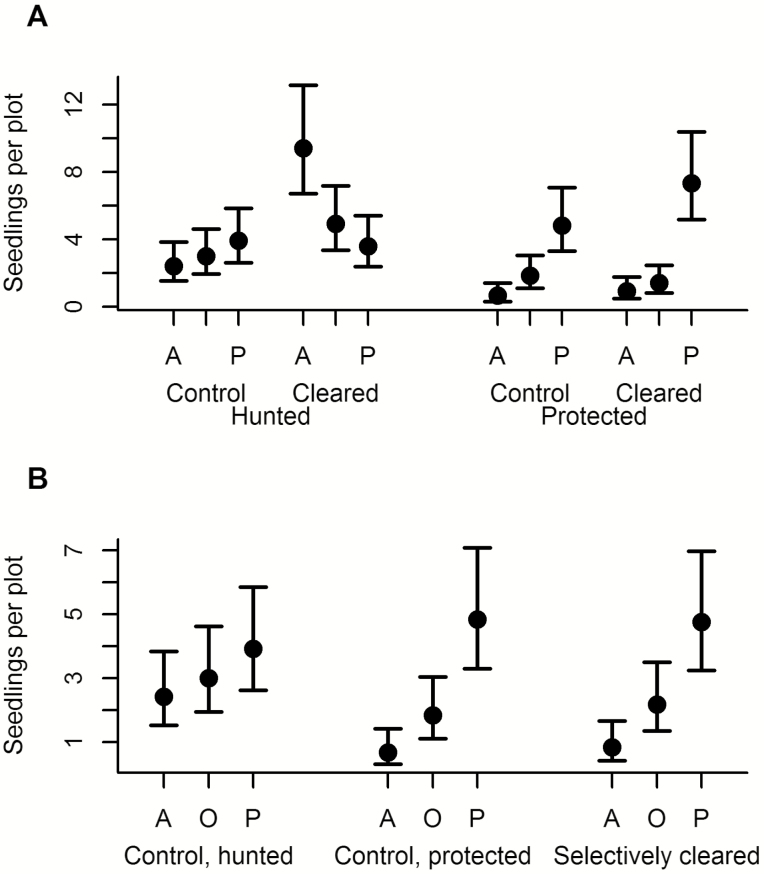
Figure 1.
(A) Number of germinating seedlings in hunted and protected sites and in control and completely cleared plots. A represents abiotically dispersed seedlings, P represents primate-dispersed seedlings, while O are seedlings dispersed by other animals rather than primates. The dots are the estimated marginal means from analyses, and bars represent the 95 % confidence intervals of these means. That is, two groups are significantly different if the mean of one group falls outside of the interval of another group. (B) Number of germinating seedlings in selectively cleared plots located in protected sites, and in the control plots in hunted and protected sites (same as in Fig. 1A).

