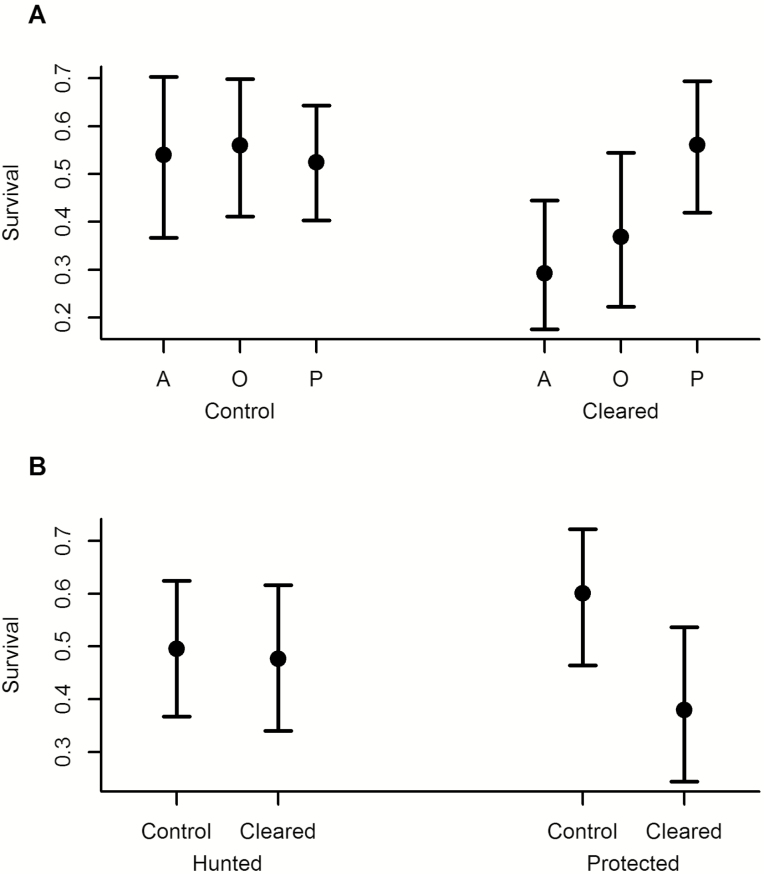
Figure 2.
(A) Survival rates of seedlings of the three dispersal modes in control and cleared plots. The dots are the estimated marginal means from analyses, and bars represent the 95 % confidence intervals of these means. (B) Survival of seedlings in control and cleared plots, in hunted and protected sites.

