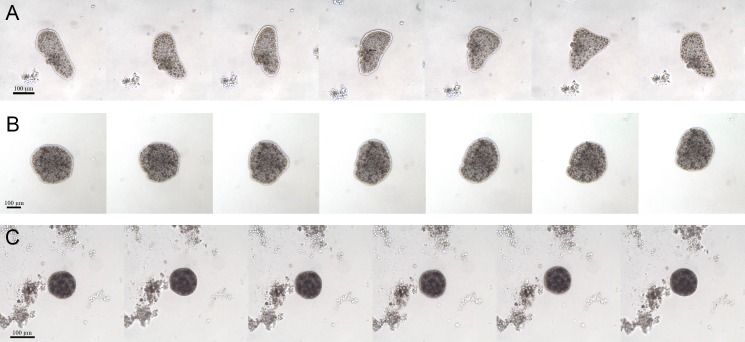
Figure 4. Changes of body shapes.
Sequence of images showing the changes of body shapes in CTRL (A), EtOH (B) and P+EtOH (C) experimental groups. All animals were taken from the cultures and photographed at the end of the experiment. Controls showed large and flattened bodies, irregular margins and evident changes in the body shape. Ethanol treated animals showed dark and flattened smaller bodies, regular margins and small changes in the body shape. P. spinosa + Ethanol treated animals showed very dark, globose bodies with small diameter and regular margins, without any changes in the body shape.

