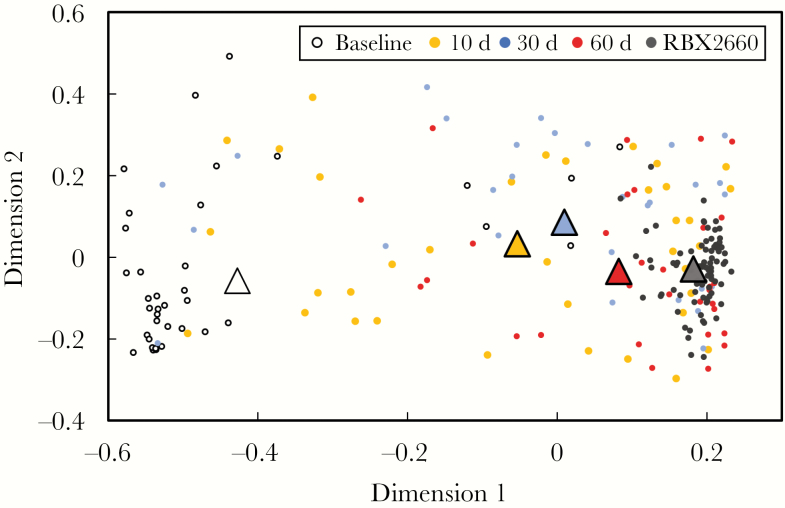
Figure 1.
Multidimensional scaling analysis based on Bray-Curtis dissimilarity for RBX2660 product samples and RBX2660 responder samples before treatment (baseline) and 10, 30, and 60 days after treatment. The mean microbiome composition for each time point group (triangles) was calculated based on least-squares fit to a Dirichlet multinomial and was included in the analysis.

