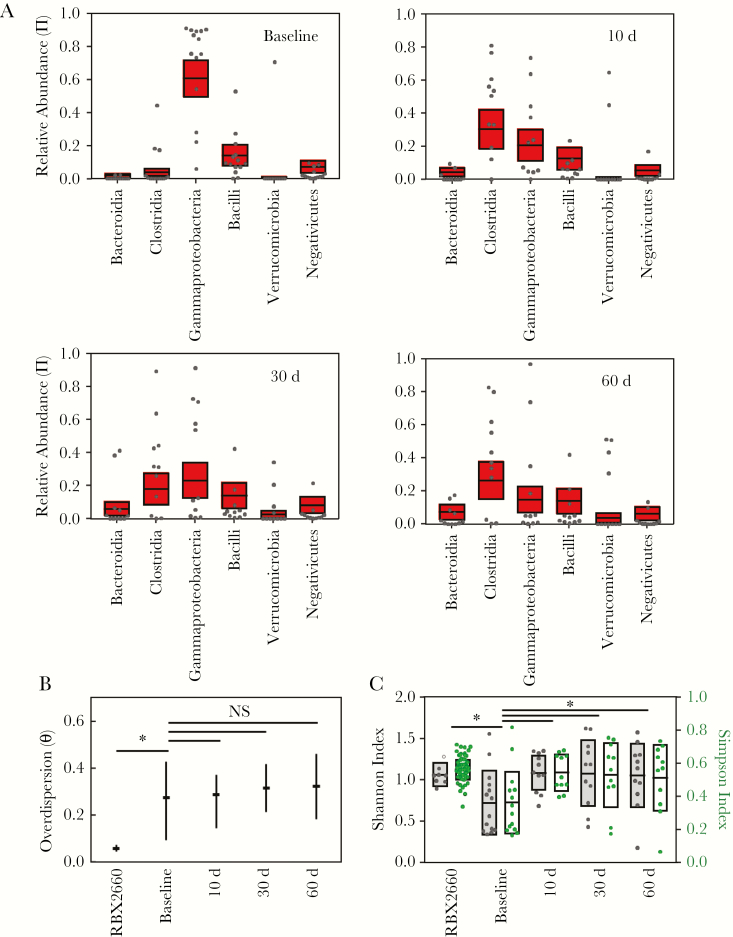
Figure 6.
Sample and group mean taxonomic compositions and diversity among RBX2660 product samples and placebo responder samples before treatment (baseline) and 10, 30, and 60 days after treatment. A, Relative abundance of taxonomic classes present at ≥5% abundance, including Bacteroidia, Clostridia, Gammaproteobacteria, Bacilli, Verrucomicrobia, and Negativicutes. Individual samples are represented as dots, and group means (π) with upper and lower confidence intervals (red boxes) were calculated based on maximum likelihood estimate using the Dirichlet multinomial. B, Overdispersion (θ) for sample groups, shown as median with upper and lower confidence intervals calculated using the method of moments. Comparisons among time groups are noted as significant (*P < .05) or not significant (NS). C, Alpha diversity for individuals and sample groups, expressed as the Simpson or Shannon index. Boxes represent group means with standard deviations. *P < .05 (Wilcoxon test).

