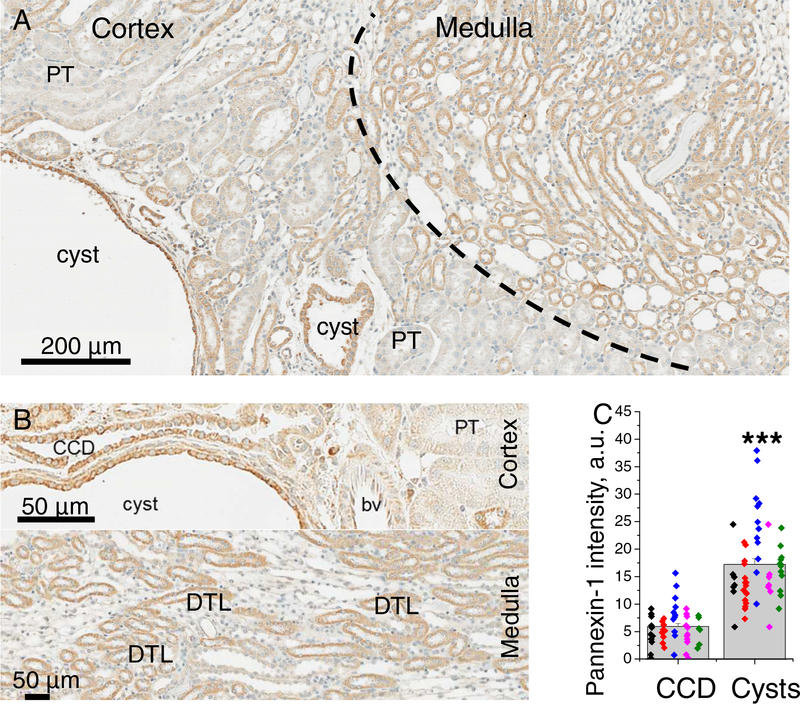
Figure 1. Pannexin-1 distribution in Pkd1RC/RC mouse kidneys.
A - staining at 10x magnification shows Panx1 expression in cortex and medulla. B - in the cortex, Panx1 signal is prominent in cysts and non-dilated collecting ducts; in the medulla - in DTL. C -quantification reveals significantly higher labelling in cysts vs collecting ducts. Each color represents one animal; CCD - collecting duct, PT -proximal tubule, DTL - descending thin limb, bv - blood vessel

