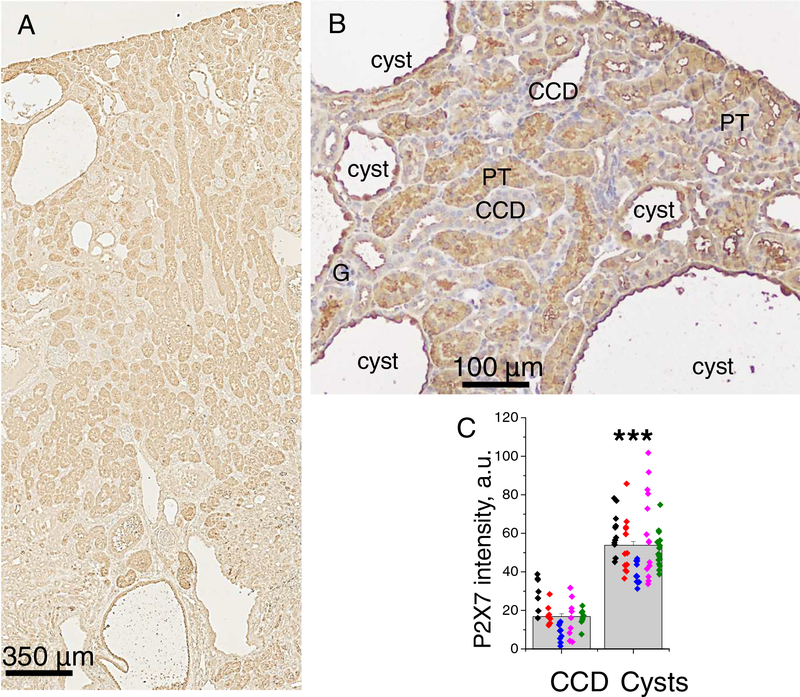
Figure 2. P2X7 distribution in Pkd1RC/RC mouse kidneys.
A - P2X7 staining in cortex and medulla. B - P2X7 abundance elevates during transition of CCDs to cysts; non-dilated CCD have low signal, developing cysts exhibit increased level especially in principal cells, mature cysts have strong P2X7 labeling in apical membranes of the cyst lining-cells. C - summary graph quantifies an enhanced expression of P2X in cysts vs collecting ducts. Each color represents one animal.

