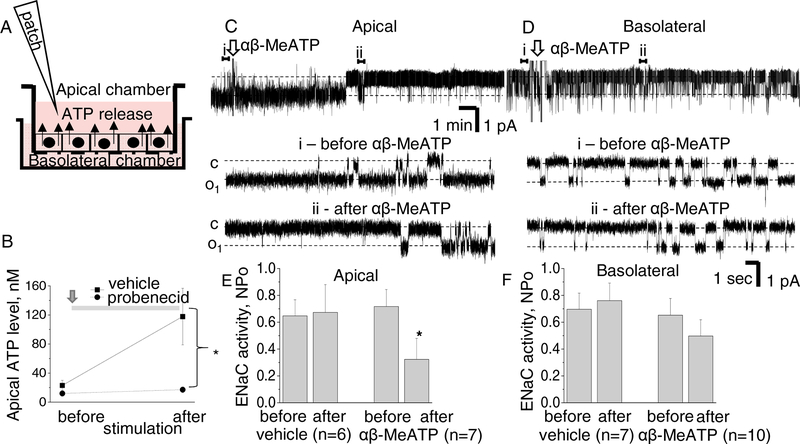
Figure 3. ATP release by M1 cells and the effect of P2X stimulation on ENaC.
A - scheme of Transwell Corning system demonstrates that M1 cells form polarized tight epithelial monolayer which separates apical and basolateral chambers. B - accumulation of ATP in the apical chamber during 1 hr mechanical stimulation with rocking is inhibited by treatment with 50 μM probenecid. C,D - 100 μM αβ-MeATP was applied into apical (C) or basolateral (D) chambers. Upper traces are recordings of ENaC activity, arrows denote application of the drug. Representative sections before (i) and after (ii) are expanded below. “c” and “o1” denote closed and opened states of the channel, respectively; scale bars for entire and expanded traces are shown; holding potential is −40 mV; openings are downward. E,F - Summary graphs demonstrate that apical application of αβ-MeATP acutely decreases activity of ENaC whereas basolateral or control application of vehicle have no effect.

