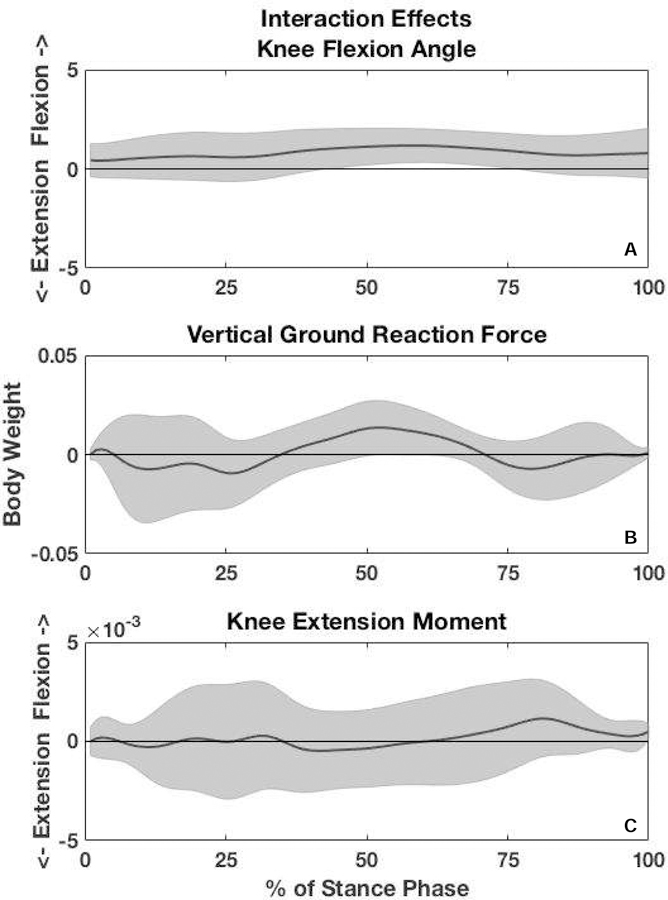
Figure 1.

Interaction effects between response groups (strength responders and strength non-responders) and time (baseline and 4-weeks). The y-axis represents the differences between groups in the changes made from baseline to 4-weeks. The shaded gray area encompasses the upper and lower 95% confidence intervals. There was a significant interaction in knee flexion angle in mid-stance. Vertical ground reaction force approached a significant interaction, but there was no interaction for internal knee extension moment.
