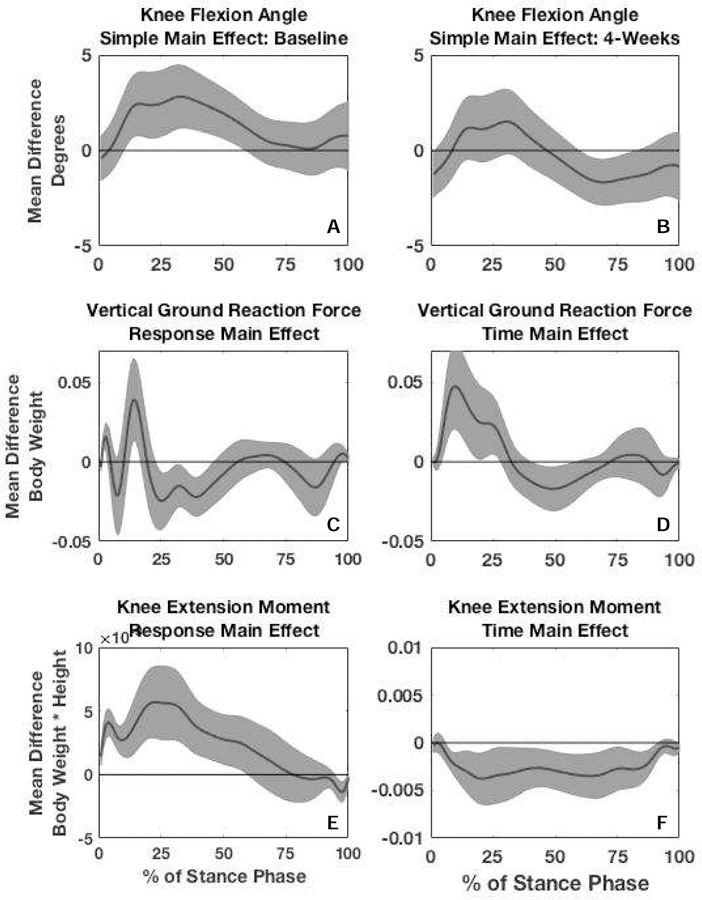
Figure 3.

Simple main effects for knee flexion angle (KFA) were calculated by plotting the mean difference in KFA (solid black line) between responders and non-responders at baseline (3A) and 4-weeks (3B) and surrounding 95% confidence intervals (gray shading around solid black line). Main effect for response for vertical ground reaction force (vGRF) (3C) and internal knee extension moment (KEM) (3E) were calculated by plotting the mean difference in vGRF and KEM between responders and non-responders collapsed across time. Main effect for time for vGRF (3D) and KEM (3F) was calculated by plotting the mean difference in vGRF and KEM between 4-weeks and baseline collapsed across response group. Significant differences were identified as any part of stance phase where the 95% confidence intervals of the difference did not overlap zero.
