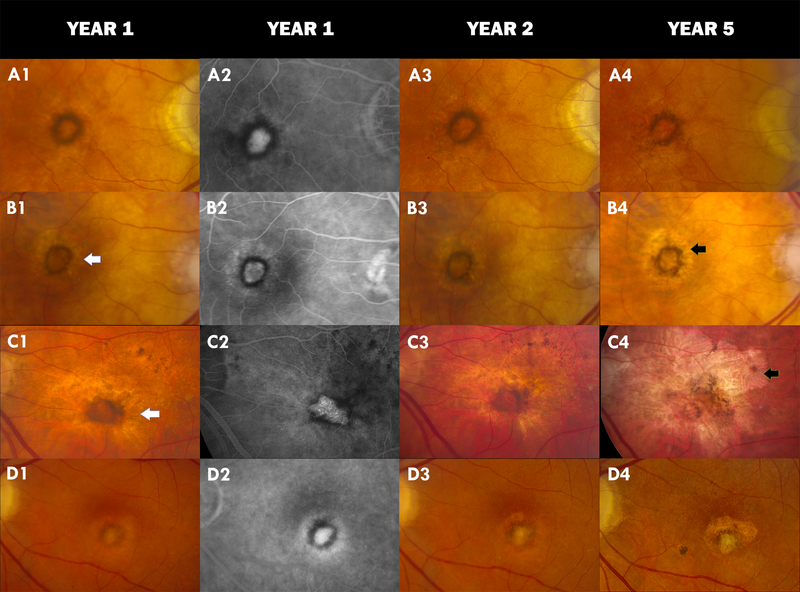
Figure 1:
Color fundus photograph (CFP) and Fluorescein Angiogram (FA) images of non-fibrotic scar (NFS) in four different CATT subjects: A1 shows a typical NFS at year 1 with hyperpigmentation encircling an area of hypopigmentation on CFP. A2 is the corresponding FA showing an inner hyperfluorescence surrounded by circular hypofluorescence. No changes are seen at year 2 (A3) but part of the pigmentation at 7 o’clock has disappeared in the year 5 CFP (A4). B1 and B2 show a halo of non-geographic atrophy (NGA) surrounding the NFS in year 1. This persists in year 2 (B3) and intensifies into geographic atrophy (GA) at year 5 (B4); C1–C3 show NGA surrounding the NFS at years 1 and 2 with development of a large GA at year 5 (C4) and the disappearance of more than half of the circular hyperpigmentation of the NFS; D1 and D2 show a NFS which develops fibrosis within the hyperpigmented ring at year 2 (D3) that is more pronounced at year 5 (D4). Some amount of fibrosis is also observed superiorly overlying an area of geographic atrophy. White arrow=NGA. Black arrow=GA.

