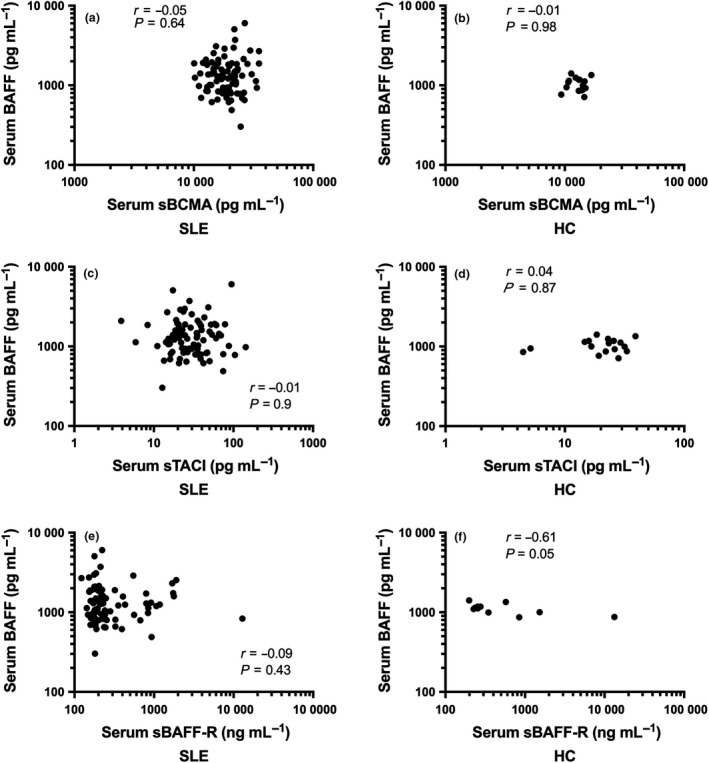
Figure 2.

Correlation between serum BAFF and soluble BAFF receptors in SLE and HC. Correlation between serum BAFF and sBCMA concentrations in (a) SLE (N = 87) and (b) HC (N = 17). Correlation between serum BAFF and sTACI concentrations in (c) SLE (N = 87) and (d) HC (N = 17). Correlation between serum BAFF and sBAFF‐R concentrations in (e) SLE (N = 87) and (f) HC (N = 11). In a–f, correlations were examined using Spearman correlation test.
