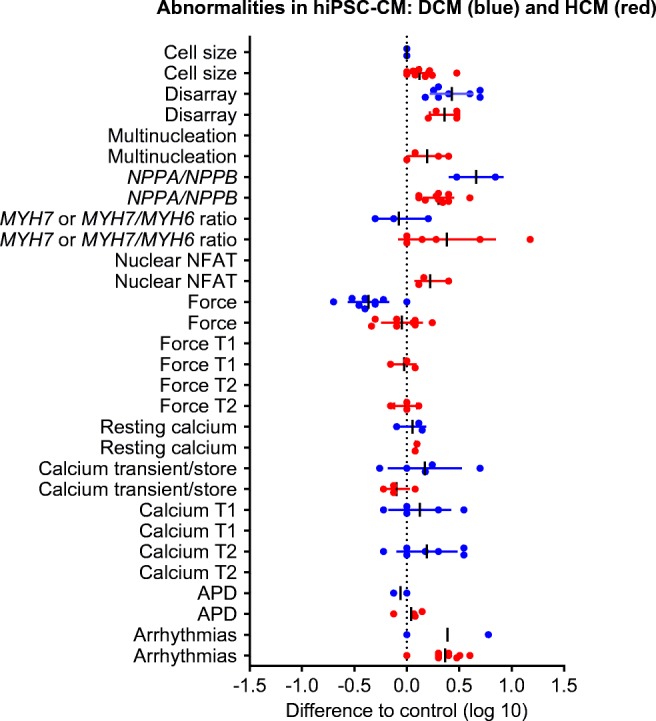
Fig. 1.

Published abnormalities of structure, gene expression or function of HCM/DCM-derived hiPSC-CM (HCM in red, DCM in blue). The data were extracted from the studies summarized in the Tables and are expressed as fold (log scale) of the control used in the respective study (either healthy control or gene edited isogenic line). More detail is provided in Tables 1 and 2. Each dot indicates one study. Lack of dots for certain parameters (e.g. force T1/T2 for DCM) indicates that none of the studies has reported these parameters. Abbreviations used: NPPA/NPPB atrial/brain natriuretic peptide (mRNA or protein concentration/positivity), MYH7/MYH6 β/α-myosin heavy chain gene expression, T1 time to peak of contraction or (calcium T1) of calcium transient peak, T2 time from contraction peak or (calcium T2) of calcium transient peak to relaxation/decay, APD action potential duration. The line calcium transient/store combines data on the peak calcium transient under baseline or caffeine-induced conditions
