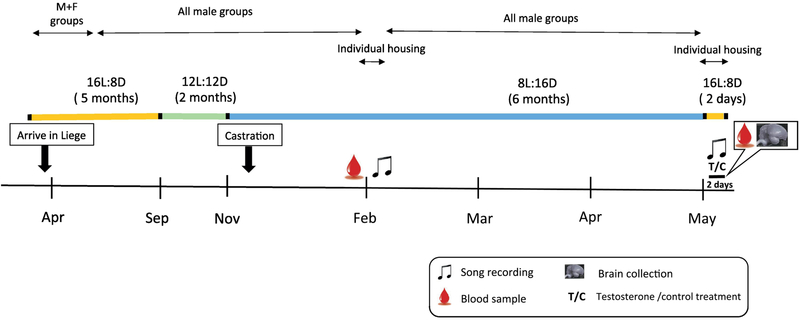
Figure 1.
Schematic representation of the endocrine and photoperiodic background of the males used in this experiment. The duration of each experimental phase is indicated by the months on the time line and further described in detail in the text but the durations are not strictly proportional to their length in the figure to allow representation of the experimental phase.

